Chris Martz (@chrismartzwx) 's Twitter Profile
Chris Martz

@chrismartzwx

Meteorology student. Climate + energy. Python programmer. Weather guesser. Opinions my own. They call me Martzy. facebook.com/ChrisMartzWX

ID: 1060632416434434049

linkhttp://cfact.org calendar_today08-11-2018 20:37:28

49,49K Tweet

117,117K Followers

998 Following

Chris Martz (@chrismartzwx) 's Twitter Profile Photo

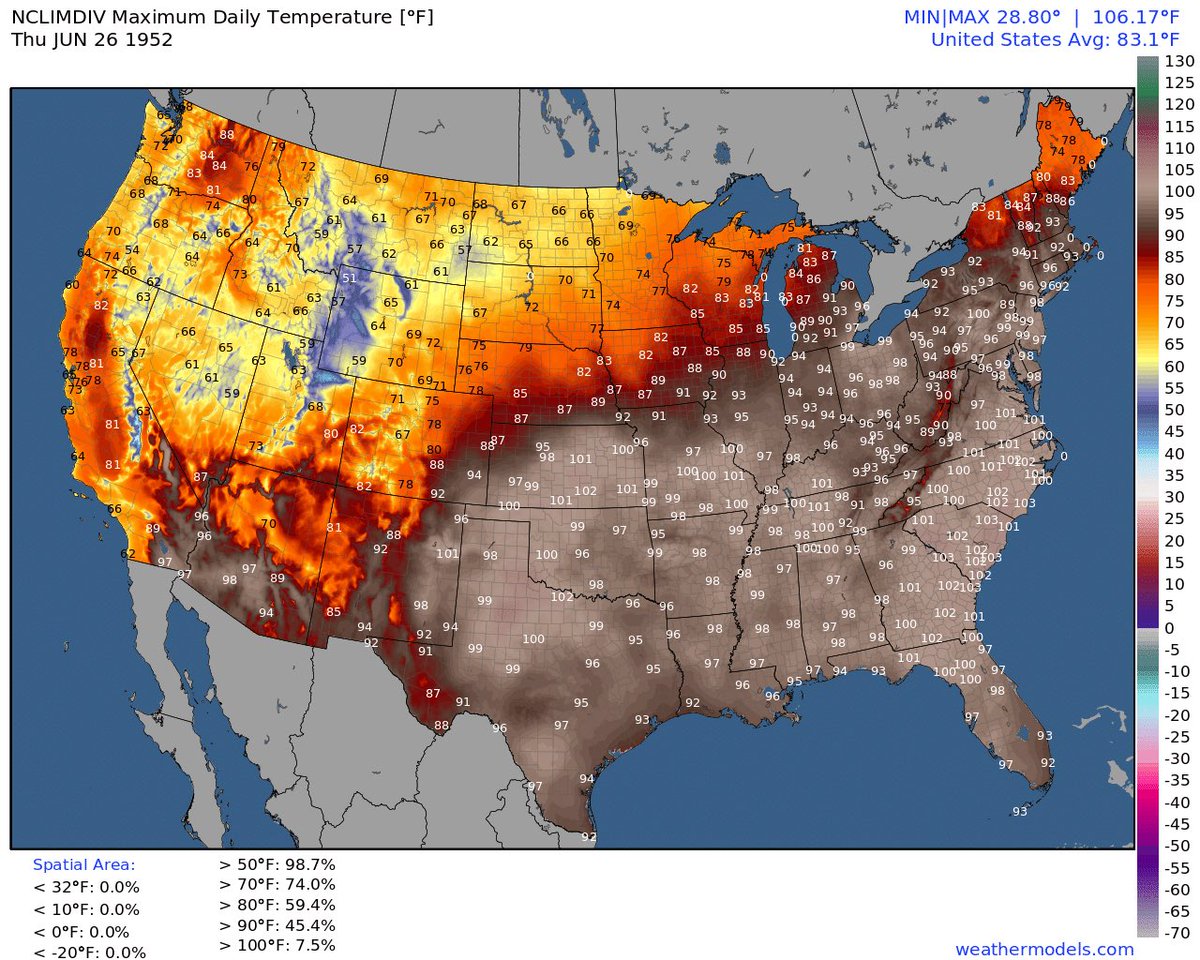
It’s called summer, Pramila. Summer. šŸ–ļø Here are the highs from this date in 1952. Was it climate change then?

It’s called summer, Pramila.

Summer. šŸ–ļø 

Here are the highs from this date in 1952. Was it climate change then?
Chris Martz (@chrismartzwx) 's Twitter Profile Photo

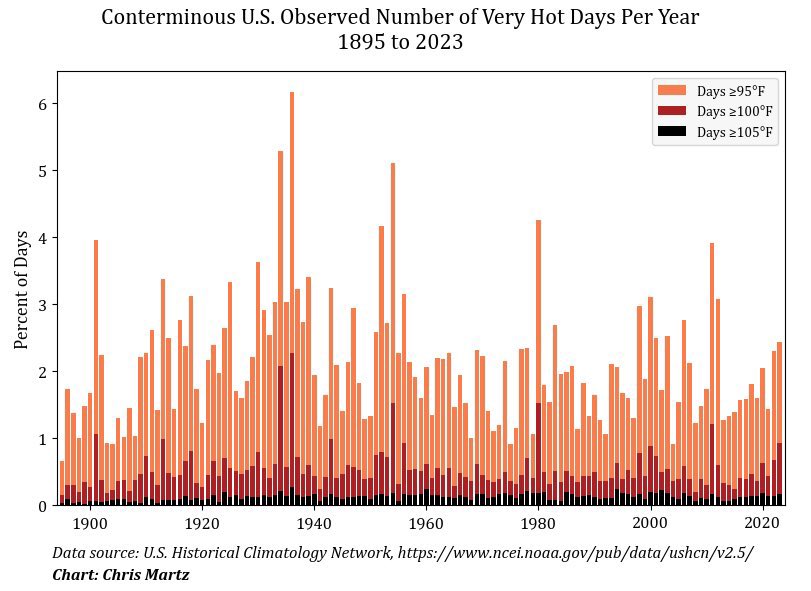
Summers in the U.S. are hot. šŸ”„ They aways have been hot and always will be as long as this little blue and green marble keeps spinnin’ ā€˜round. šŸŒŽ Some summers are hotter than others. That is the nature of the beast. This should be obvious to any individual smarter than a sea

Summers in the U.S. are hot. šŸ”„

They aways have been hot and always will be as long as this little blue and green marble keeps spinnin’ ā€˜round. šŸŒŽ

Some summers are hotter than others. That is the nature of the beast. 

This should be obvious to any individual smarter than a sea
Chris Martz (@chrismartzwx) 's Twitter Profile Photo

This is very misleading. 🤄 First, that map shows the heat index (i.e., the ā€œfeels-like temperatureā€), not actual air temperature. Either you [or whoever you grabbed this image from] deliberately cropped that critical information out from that map off of weathermodels.com.

This is very misleading. 🤄

First, that map shows the heat index (i.e., the ā€œfeels-like temperatureā€), not actual air temperature. Either you [or whoever you grabbed this image from] deliberately cropped that critical information out from that map off of <a href="/weathermodels_/">weathermodels.com</a>.
Chris Martz (@chrismartzwx) 's Twitter Profile Photo

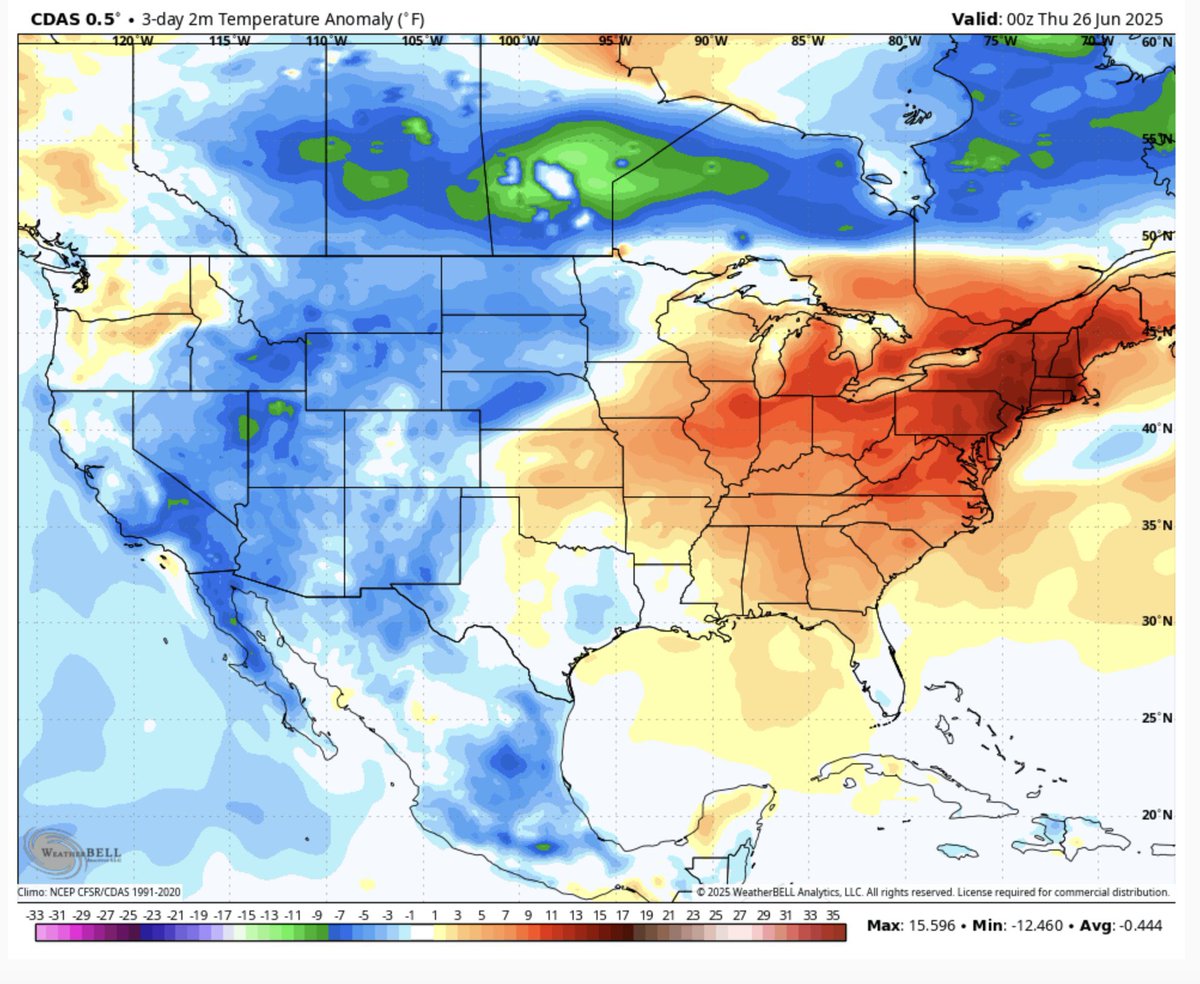
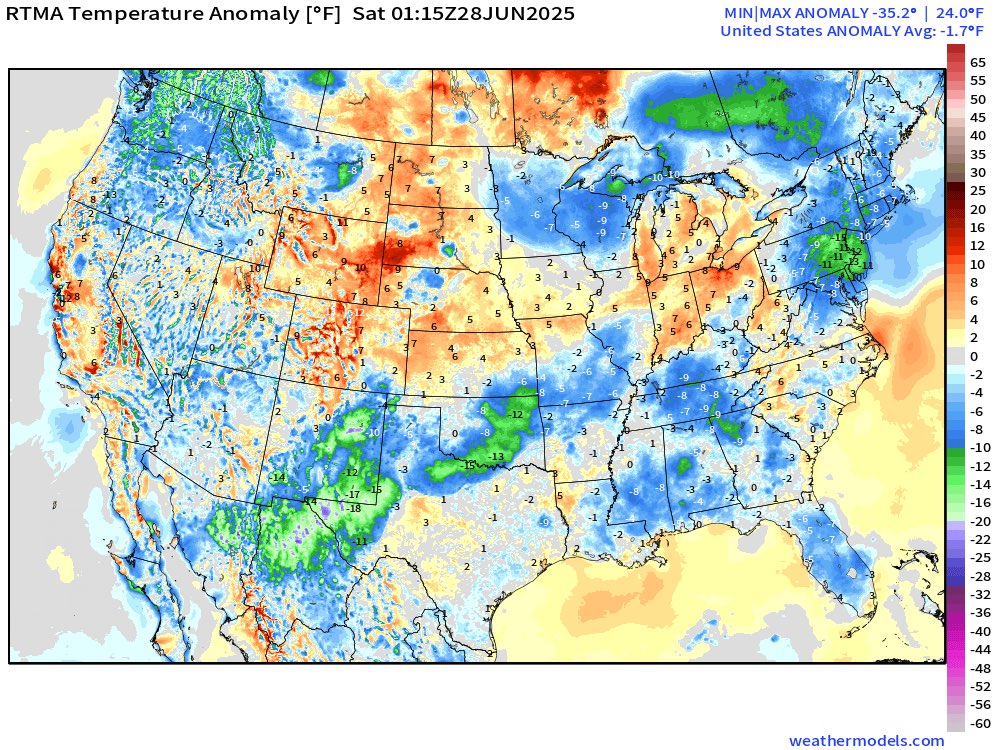
Anytime there is ā€œextreme heatā€ (relative to average), extreme cold will be nearby to compensate for it. Out west this week, temperatures have been running several degrees below average, which facilitated mountain snow. But, the news media will only fixate on the heat in the

Anytime there is ā€œextreme heatā€ (relative to average), extreme cold will be nearby to compensate for it. Out west this week, temperatures have been running several degrees below average, which facilitated mountain snow. But, the news media will only fixate on the heat in the
Chris Martz (@chrismartzwx) 's Twitter Profile Photo

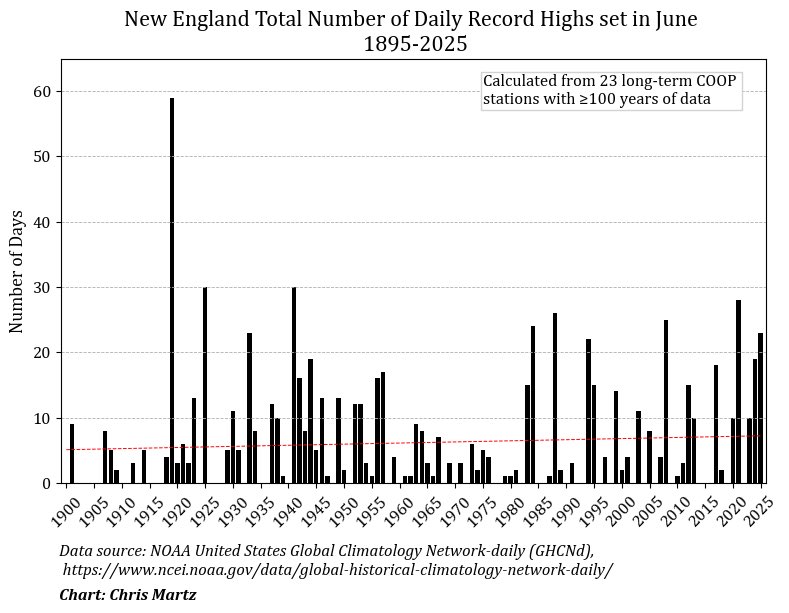
The most intense heat in the U.S. this week (relative to average) has been in New England. So, I thought I’d take a bit closer look at long-term trends there. As it turns out, the average number of days per year ≄90°F (32°C), ≄95°F (35°C) and ≄100°F (38°C) have not increased

The most intense heat in the U.S. this week (relative to average) has been in New England. So, I thought I’d take a bit closer look at long-term trends there.

As it turns out, the average number of days per year ≄90°F (32°C), ≄95°F (35°C) and ≄100°F (38°C) have not increased
Chris Martz (@chrismartzwx) 's Twitter Profile Photo

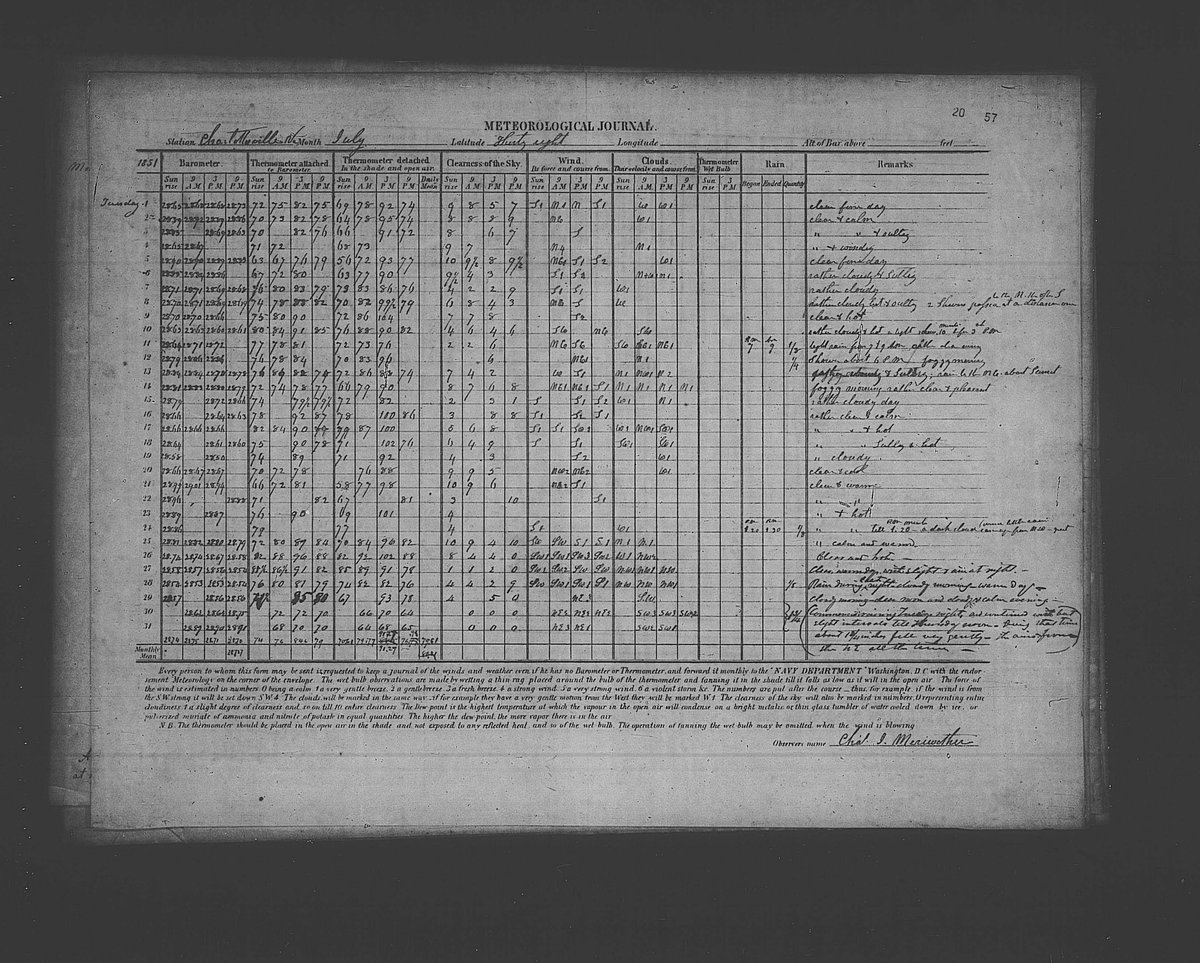
During July 1851, Charlottesville, Virginia recorded seven days of ≄100°F (including July 8th’s 99.5°F reading that would round up). If included in the official record (1895-present), the only July that would have more would be July 1930. The high of 104°F on July 9th eclipses

During July 1851, Charlottesville, Virginia recorded seven days of ≄100°F (including July 8th’s 99.5°F reading that would round up). If included in the official record (1895-present), the only July that would have more would be July 1930. 

The high of 104°F on July 9th eclipses
Chris Martz (@chrismartzwx) 's Twitter Profile Photo

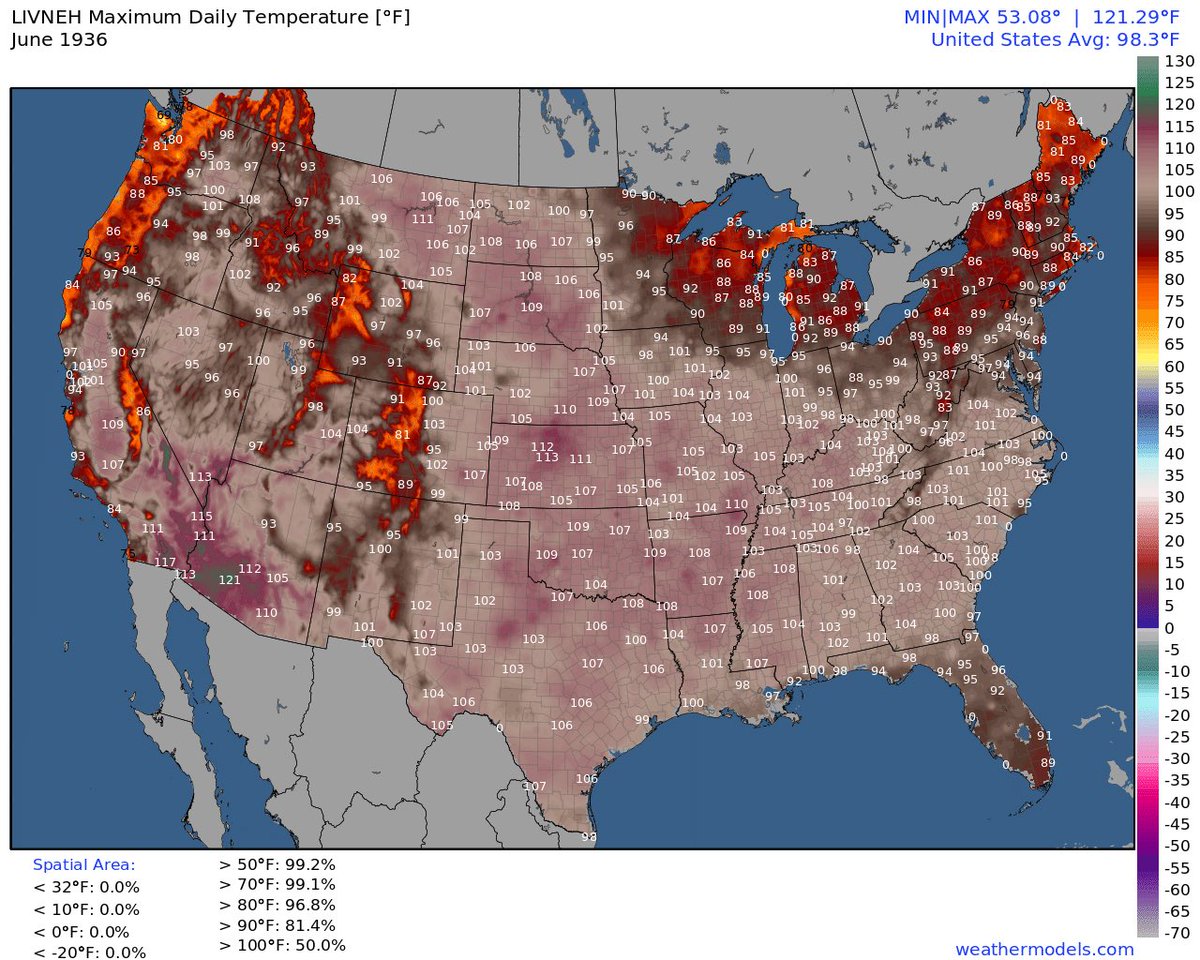
The map below shows the highest temperatures reached during the month of June 1936. Apart from New England, most of the Lower 48 observed more extreme heat in June 1936 than we have seen in June so far this year. This summer is probably not going to be anywhere close to the

The map below shows the highest temperatures reached during the month of June 1936. 

Apart from New England, most of the Lower 48 observed more extreme heat in June 1936 than we have seen in June so far this year. 

This summer is probably not going to be anywhere close to the
Chris Martz (@chrismartzwx) 's Twitter Profile Photo

I love how climate alarmists are blaming people like me for the Trump administration gutting climate ā€œresearchā€ at federal agencies. They really have nobody to blame but themselves because they have been chanting that ā€œthe science is settledā€ and ā€œthe debate is overā€ for the

Chris Martz (@chrismartzwx) 's Twitter Profile Photo

The heatwave is effectively over. I guess the atmosphere ran out of the so-called ā€œclimate fuel.ā€ ā›½ļø The high in D.C. today was only 72°. 23° cooler than yesterday thanks to a bit of cloud cover and light showers. šŸŒ§ļø

The heatwave is effectively over.

I guess the atmosphere ran out of the so-called ā€œclimate fuel.ā€ ā›½ļø 

The high in D.C. today was only 72°.

23° cooler than yesterday thanks to a bit of cloud cover and light showers. šŸŒ§ļø
Chris Martz (@chrismartzwx) 's Twitter Profile Photo

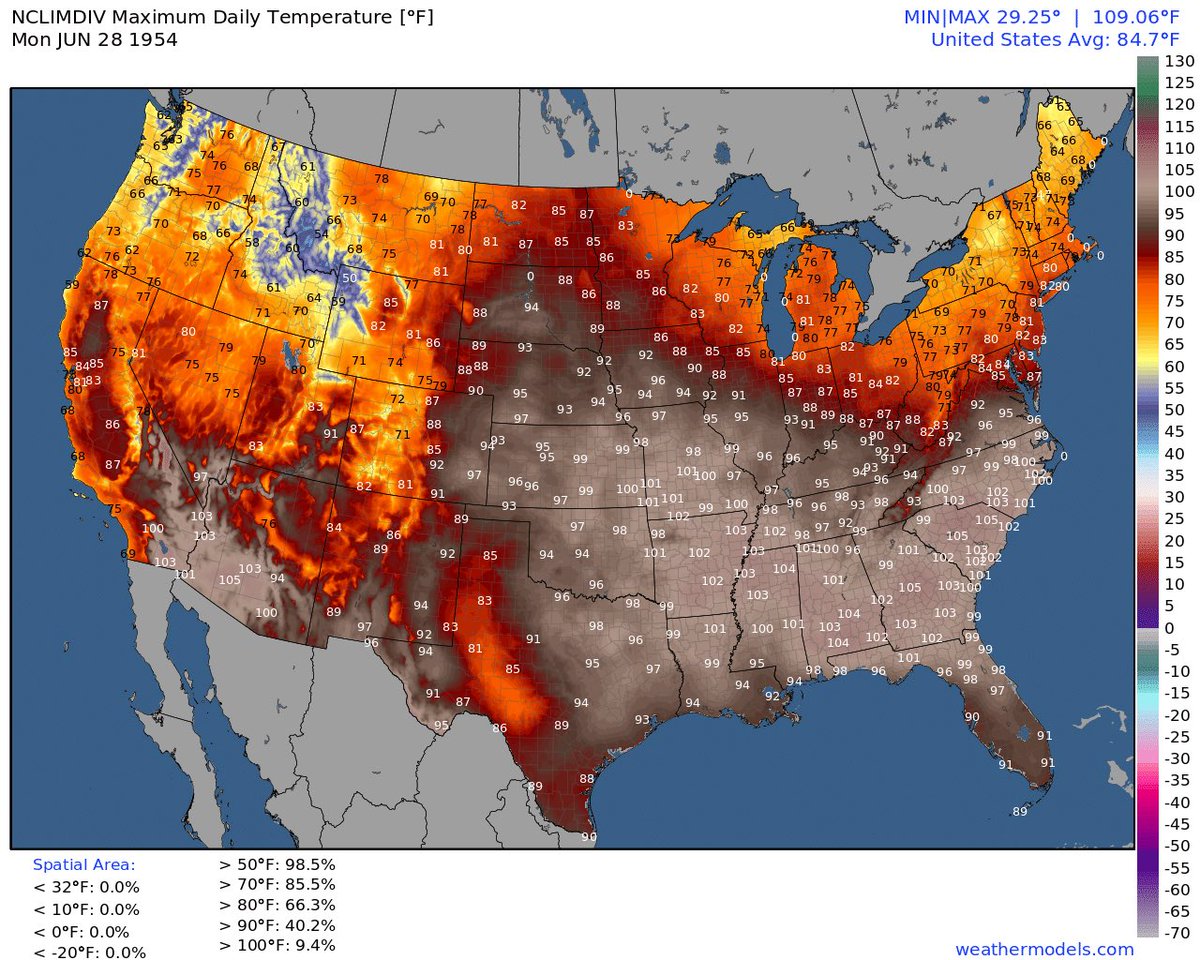
On June 28, 1954, 36 states reached 90°F (32°C), 23 of which reached 100°F (35°C). By state, it was: • 111° in South Carolina (Camden) • 110° in California (Cow Creek) • 110° in Georgia (Eastman) • 108° in Alabama (Greenville and Selma) • 108° in Arizona (Gila Bend) •

On June 28, 1954, 36 states reached 90°F (32°C), 23 of which reached 100°F (35°C).

By state, it was: 

• 111° in South Carolina (Camden)
• 110° in California (Cow Creek)
• 110° in Georgia (Eastman)
• 108° in Alabama (Greenville and Selma)
• 108° in Arizona (Gila Bend)
•
Chris Martz (@chrismartzwx) 's Twitter Profile Photo

It’s simple, Joey. Because actual conservationists do not want tens of thousands of acres of forest felled just to cover the it up with solar panels when a greater number of homes can be powered by natural gas or nuclear, which require far less land. Rooftop solar is fine (if