Chimdi Nwosu (@datavizchimdi) 's Twitter Profile
Chimdi Nwosu

@datavizchimdi

Dataviz Doer | Tableau Visionary and Ambassador | 12 × #VOTD | 6 x #Vizzies | vizsight.com | #MakeoverMonday | #TUGs | @DuboisChallenge @AnalyticsTUG

ID: 509187346

linkhttp://bit.ly/3Zp7sH3 calendar_today29-02-2012 20:20:32

5,5K Tweet

4,4K Followers

1,1K Following

Anthony Starks (@ajstarks) 's Twitter Profile Photo

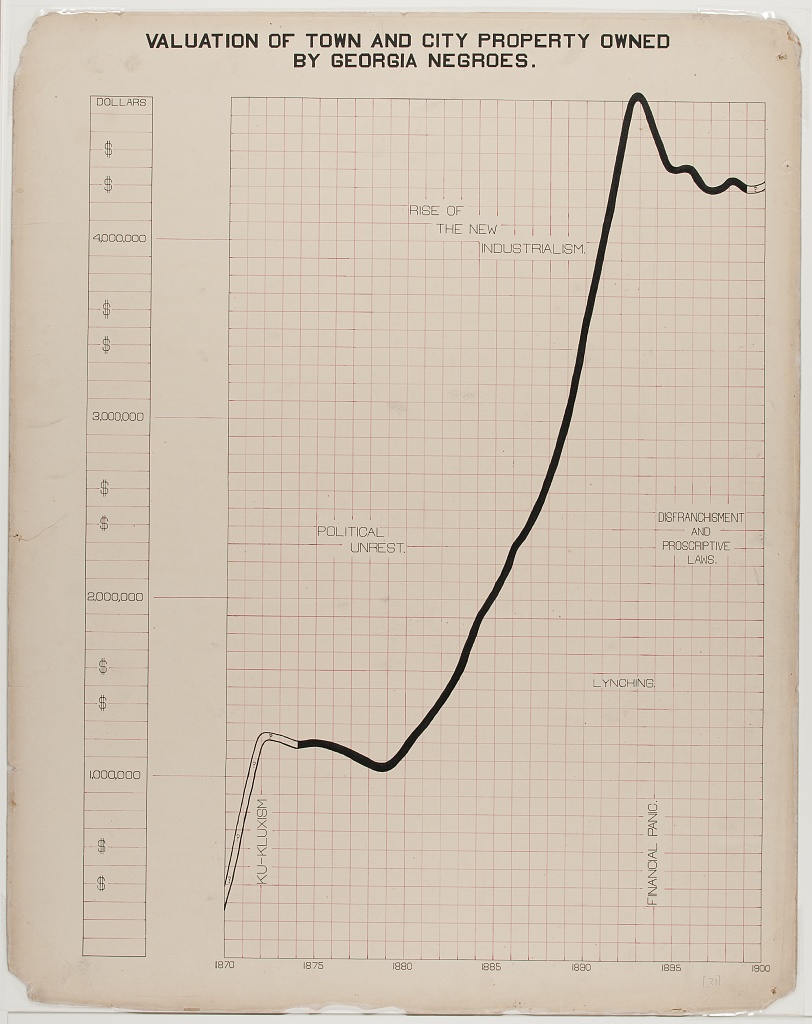
#DuboisChallenge2025, Week 4: "Valuation of Town and City Property Owned by Georgia Negroes" shows a large growth of property owned from 1880-1895 ("Rise of the New Industrialism"). Note the other annotations of contemporary issues ("Financial Panic", "Lynching")

#DuboisChallenge2025, Week 4: "Valuation of Town and City Property Owned by Georgia Negroes" shows a large growth of property owned from 1880-1895 ("Rise of the New Industrialism"). Note the other annotations of contemporary issues ("Financial Panic", "Lynching")
Gbóláhàn Adébáyò (@gbolahaann) 's Twitter Profile Photo

New Business Dashboard Viz 📊 Explore: public.tableau.com/app/profile/gb… Sharing my first business dashboard of the year: A Product Comparison Dashboard. Scenario: A store, that sells electronic headsets, aims to compare the performance of its products across different metrics over a

Kevin Flerlage (@flerlagekev) 's Twitter Profile Photo

New Blog Post - Variable Offset Label Bar Chart Ever had so many header labels on a bar chart that they wrap and get cut off? Well, this variable offset label technique might be your solution. Check it out: Link: flerlagetwins.com/2025/02/variab…

Kevin Wee 黃克文 (@kevinwee90) 's Twitter Profile Photo

🚨 NEW VIZ: Hi #datafam, check out my latest Tableau viz, "Contextual Legends & Their Applications," showing 3+ custom legend designs w/ unique functions & 10 use cases on #dashboard development. Link: rb.gy/c137ee Salesforce Tableau Public #dataviz (1/n)

Anthony Starks (@ajstarks) 's Twitter Profile Photo

#DuboisChallenge2025, week 6: This unconventional chart uses a "woven" pattern of horizontal and vertical bars to compare the property ownership of Black people from 1880-1899 in Savannah and Atlanta. The value of property owned in Atlanta in 1898 was the highest at $1,308,955

#DuboisChallenge2025, week 6: This unconventional chart uses a "woven" pattern of horizontal and vertical bars to compare the property ownership of Black people from 1880-1899 in Savannah and Atlanta. The value of property owned in Atlanta in 1898 was the highest at $1,308,955
Anthony Starks (@ajstarks) 's Twitter Profile Photo

#DuboisChallenge2025, week 9: "Occupations of Negroes and Whites in Georgia" is not quite an pie chart, but a "fan chart", comparing the occupations of two groups. The chart is a good example of the typical Du Bois color palette.

#DuboisChallenge2025, week 9: "Occupations of Negroes and Whites in Georgia" is not quite an pie chart, but a "fan chart", comparing the occupations of two groups. The chart is a good example of the typical Du Bois color palette.
Shreya Arya (@datavizfairy) 's Twitter Profile Photo

If a chart isn’t clear, it’s not doing its job. Here are 8 TIPS to help you improve clarity, layout, and focus 💜📊 This week we have a special #B2VB x #MakeoverMonday collab challenge - improve a real chart from ActivTrak’s 2024 Productivity Benchmarks Report! Prompt:

Anthony Starks (@ajstarks) 's Twitter Profile Photo

The horizontal stacked bar charts shows how various social-economic groups spend their income among these categories: Rent, Food, Clothes, Taxes, and other expenses and giving. This visual is distinct in that it includes photographs along with the chart. #DuboisChallenge2025

The horizontal stacked bar charts shows how various social-economic groups spend their income among these categories: Rent, Food, Clothes, Taxes, and other expenses and giving. This visual is distinct in that it includes photographs along with the chart. #DuboisChallenge2025
Tableau (@tableau) 's Twitter Profile Photo

Watch the ultimate data visualization showdown—#IronViz 2025! Tune in to see chart-topping performances from Bo McCready, Ryan Soares and Kathryn McCrindle! x.com/i/broadcasts/1…

Tableau (@tableau) 's Twitter Profile Photo

Welcome to a new Slack workspace—just for you #DataFam! Connect with community leaders, get involved with Tableau User Groups, dive into community projects, and take your data journey to the next level. Join the Tableau Community, now on Slack! tabsoft.co/3GuzHzN

Welcome to a new Slack workspace—just for you #DataFam!

Connect with community leaders, get involved with Tableau User Groups, dive into community projects, and take your data journey to the next level.

Join the Tableau Community, now on Slack! tabsoft.co/3GuzHzN
Tableau (@tableau) 's Twitter Profile Photo

The latest visualizations, data tips, and upcoming ways to connect with the Tableau Community—all in this week's #DataFam Roundup. tabsoft.co/4kiSnBb

The latest visualizations, data tips, and upcoming ways to connect with the Tableau Community—all in this week's #DataFam Roundup.

tabsoft.co/4kiSnBb
Tableau (@tableau) 's Twitter Profile Photo

The DataFam Roundup brings Tableau Community content together, all in one place. Learn new data skills and get inspired by the latest visualizations. tabsoft.co/3T9GLoG

The DataFam Roundup brings Tableau Community content together, all in one place. 

Learn new data skills and get inspired by the latest visualizations. tabsoft.co/3T9GLoG
Tableau (@tableau) 's Twitter Profile Photo

Applications and nominations for the next Tableau Ambassador cohort are now open! 🎉 Teach. Share. Lead. Innovate. Inspire. Application open now through July 25: tabsoft.co/4l0RmOU

Applications and nominations for the next Tableau Ambassador cohort are now open! 🎉

Teach. Share. Lead. Innovate. Inspire. Application open now through July 25: tabsoft.co/4l0RmOU
Tableau Public (@tableaupublic) 's Twitter Profile Photo

This #VizOfTheDay by Chimdi Nwosu—a #MakeoverMonday tracker—explores weekly submissions by participant, top weeks by submission count, and more. Learn new chart types, and discover compelling datasets with this viz on Tableau Public. tabsoft.co/4eDA8VM

This #VizOfTheDay by <a href="/DatavizChimdi/">Chimdi Nwosu</a>—a #MakeoverMonday tracker—explores weekly submissions by participant, top weeks by submission count, and more. 
 
Learn new chart types, and discover compelling datasets with this viz on Tableau Public. tabsoft.co/4eDA8VM