Kiran Patel (@drkiranpatel1) 's Twitter Profile
Kiran Patel

@drkiranpatel1

Cardiology specialist registrar | NHLI | Imperial College London | Obesity and cardiac electrophysiology

ID: 1073169051353001984

linkhttp://www.imperial.ac.uk/people/kiran.patel calendar_today13-12-2018 10:53:35

1,1K Tweet

641 Followers

1,1K Following

Mounir Basalus (Ⲃⲁⲥⲓⲗⲓⲟⲥ) (@basalus) 's Twitter Profile Photo

6/ TL;DR (Too Long; Didn’t Record) To confirm true septal RV lead position: •✅ Positive V6 •✅ Positive inferior lead •✅ QR in aVL •✅ RAO/LAO positioning •✅ Confirm with CT when needed Septal > Free Wall. Precision matters. #Pacemaker #MedTwitter

Ritika Tuli (@ritikatulimd) 's Twitter Profile Photo

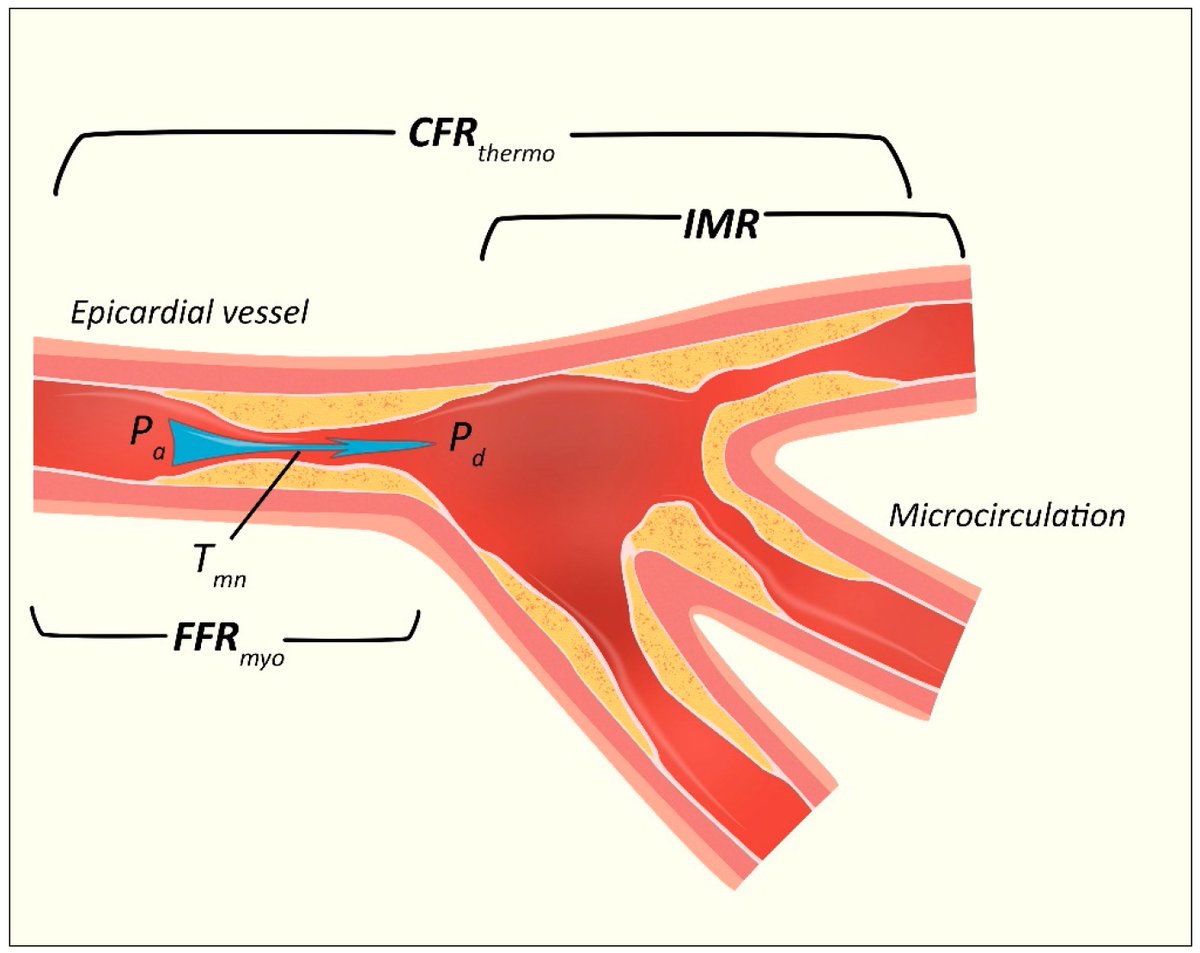
🚨 #CardioNuggets: Decoding Coronary Physiology in the Cath Lab CFR (Coronary Flow Reserve) = Total flow capacity   CFR = Normal > 2.0 FFR (Fractional Flow Reserve) = Epicardial disease?   FFR = Pd/Pa → Normal ≥ 0.80 IMR (Index of Microcirculatory Resistance) =

🚨 #CardioNuggets: 

Decoding Coronary Physiology in the Cath Lab 

CFR (Coronary Flow Reserve) = Total flow capacity   CFR = Normal > 2.0

FFR (Fractional Flow Reserve) = Epicardial disease?
  FFR = Pd/Pa → Normal ≥ 0.80

 IMR (Index of Microcirculatory Resistance) =
Ritika Tuli (@ritikatulimd) 's Twitter Profile Photo

#CardioNuggets 🫀 What’s High-Degree AV Block? 🔹2 or more P waves blocked in a row 🔹Not complete AV dissociation (≠ 3rd° block) 🔹Often unstable & may progress to complete block 🔹Think: pacing, especially if wide QRS or symptomatic! When evaluating high-degree AV block,

#CardioNuggets 🫀

What’s High-Degree AV Block?

🔹2 or more P waves blocked in a row
🔹Not complete AV dissociation (≠ 3rd° block)
🔹Often unstable & may progress to complete block
🔹Think: pacing, especially if wide QRS or symptomatic!

When evaluating high-degree AV block,
Ritika Tuli (@ritikatulimd) 's Twitter Profile Photo

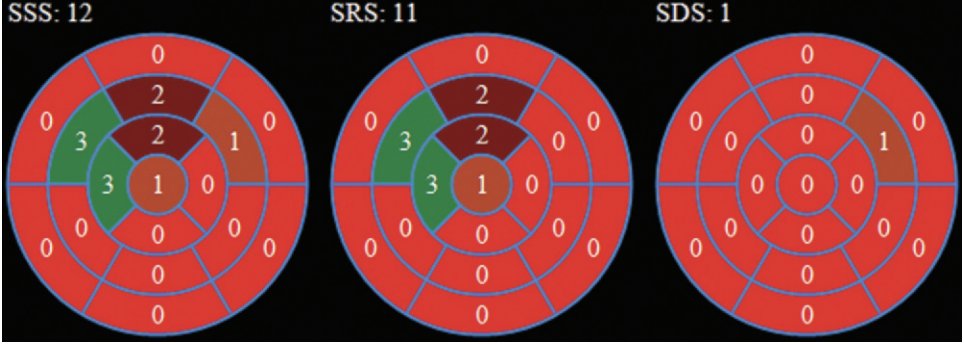
🧠 #CardioNuggets: Summed Stress Score (SSS) in Nuclear Perfusion Imaging 🫀 17 LV segments scored 0–4 (0 = normal, 4 = no uptake) ➕ Total = SSS (max 68) 🔍 Interpretation: 0–3: Normal 4–8: Mild 9–13: Mod ≥14: Severe perfusion defect 📊 SSS = Scar + Ischemia SDS =

🧠 #CardioNuggets: 

Summed Stress Score (SSS) in Nuclear Perfusion Imaging

🫀 17 LV segments scored 0–4 (0 = normal, 4 = no uptake)

➕ Total = SSS (max 68)

🔍 Interpretation:

0–3: Normal
4–8: Mild
9–13: Mod
≥14: Severe perfusion defect

📊 SSS = Scar + Ischemia

SDS =
Kiran Patel (@drkiranpatel1) 's Twitter Profile Photo

Pleased to have our commissioned manuscript published in HeartRhythm on (sub)epicardial adipose tissue as a modulator of cardiac arrhythmias. Thank you to Prof Ruben Coronel and co-authors, and as ever, to the one and only Fu Siong Ng NHLI

Lea Alhilali, MD (@teachplaygrub) 's Twitter Profile Photo

1/Do radiologists sound like they are speaking a different language when they talk about MRI? T1 shortening what? T2 prolongation who? Here’s a translation w/an introductory thread to MRI.

1/Do radiologists sound like they are speaking a different language when they talk about MRI? 

T1 shortening what? T2 prolongation who?

Here’s a translation w/an introductory thread to MRI.
CardiovascularCorner (@trackyourheart) 's Twitter Profile Photo

Myocardial Performance Index (Tei Index)= Interesting one 😍 The Tei Index, named after Dr. Chuwa Tei is a Doppler-based, noninvasive measure of global ventricular function, combining both systolic & diastolic performance. How it’s measured: ⬜ Obtained using pulsed and

Myocardial Performance Index (Tei Index)= Interesting one 😍

The Tei Index, named after Dr. Chuwa Tei is a Doppler-based, noninvasive measure of global ventricular function, combining both systolic & diastolic performance.

How it’s measured:
⬜ Obtained using pulsed and
CardiovascularCorner (@trackyourheart) 's Twitter Profile Photo

Normal & Abnormal Transmitral LV Inflow Patterns Understanding Doppler signs of LV diastolic dysfunction is key for diagnosis & prognosis. 1️⃣ Normal Diastolic Function - E/A >1, DT <220 ms - Mechanism: Normal LV relaxation & compliance → early diastolic filling dominates (E

Normal &amp; Abnormal Transmitral LV Inflow Patterns
Understanding Doppler signs of LV diastolic dysfunction is key for diagnosis &amp; prognosis.

1️⃣ Normal Diastolic Function
- E/A &gt;1, DT &lt;220 ms
- Mechanism: Normal LV relaxation &amp; compliance → early diastolic filling dominates (E
CardiovascularCorner (@trackyourheart) 's Twitter Profile Photo

Doppler Stroke Volume (Step by Step Guide) ⬜ Stroke Volume (SV) = amount of blood ejected by the LV per beat SV = CSA × VTI Step 1: Calculate CSA (Cross Sectional Area) - Measure LVOT diameter (D) in parasternal long axis (PLAX) view during mid-systole - Apply: CSA

Doppler Stroke Volume (Step by Step Guide)
⬜  Stroke Volume (SV) = amount of blood ejected by the LV per beat
           SV = CSA × VTI
 Step 1: Calculate CSA (Cross Sectional Area)
- Measure LVOT diameter (D) in parasternal long axis (PLAX) view during mid-systole
- Apply: CSA
CardiovascularCorner (@trackyourheart) 's Twitter Profile Photo

Understanding Qp/Qs Ratio: How We Measure Blood Flow Across the Heart The Qp/Qs ratio is used to determine the presence and severity of cardiac shunts, especially left-to-right shunts such as ASDs, VSDs, and PDAs. 🔹 Qp = Pulmonary Blood Flow 🔹 Qs = Systemic Blood Flow Qp/Qs =

Understanding Qp/Qs Ratio: How We Measure Blood Flow Across the Heart

The Qp/Qs ratio is used to determine the presence and severity of cardiac shunts, especially left-to-right shunts such as ASDs, VSDs, and PDAs.
🔹 Qp = Pulmonary Blood Flow
🔹 Qs = Systemic Blood Flow

Qp/Qs =
Jef Van den Eynde (@jefvandeneynde) 's Twitter Profile Photo

🚨 Heart failure (HF) decongestion ≠ simple fluid removal. Let’s explore the fascinating electrolyte changes happening behind the scenes and how they interact with diuretic therapy. 🫀💧⚡ Here follows a thread.🧵 Full review by Frederik H. Verbrugge and me: onlinelibrary.wiley.com/doi/10.1002/ej…

Ritika Tuli (@ritikatulimd) 's Twitter Profile Photo

#CardioNuggets Acceleration time and Ejection time in prosthetic aortic valve assessment: 🔹 AT = time to peak velocity 🔹 ET = total systolic ejection time Why AT/ET is useful in prosthetic aortic valves: -Gradients can be misleading—affected by flow, valve size & design -AVA

#CardioNuggets

Acceleration time and Ejection time in prosthetic aortic valve assessment:
🔹 AT = time to peak velocity
🔹 ET = total systolic ejection time

Why AT/ET is useful in prosthetic aortic valves:
-Gradients can be misleading—affected by flow, valve size &amp; design
-AVA