Charles Dussiau (@dussiauc) 's Twitter Profile
Charles Dussiau

@dussiauc

Postdoc at @EMBL and @DKFZ
@zauggj and @MilsomMick labs

Computational Hematologist

ID: 1151173162975092736

calendar_today16-07-2019 16:54:04

971 Tweet

214 Followers

510 Following

Ian Ghezzi (@ghezziian) 's Twitter Profile Photo

Delighted to showcase my preclinical results “Identification and Functional Interrogation of Dormant Cancer Stem Cells in JAK2V617F-Driven MPNs” with an oral presentation at #ASH24 in December. Happy to connect with anyone attending and to chat about science! 🤩

Ian Ghezzi (@ghezziian) 's Twitter Profile Photo

Excited to finally be at #ASH24! Will be presenting at the 631 session on Myeloproliferative Neoplasms on Monday morning from 10.30am! 🤩 However before that time you can most likely find me here!!

Excited to finally be at #ASH24! Will be presenting at the 631 session on Myeloproliferative Neoplasms on Monday morning from 10.30am! 🤩

However before that time you can most likely find me here!!
Ian Ghezzi (@ghezziian) 's Twitter Profile Photo

Fantastic kick off of #ASH24 with the Myeloid Workshop where giants of the field such as Andreas Trumpp HI-STEM - Cancer and Stem Cells in Heidelberg , Ross Levine , Peggy Goodell , Robert Signer and many other presented their impressive science!!🤯 What a better way to start the meeting! 🤓

Fantastic kick off of #ASH24 with the Myeloid Workshop where giants of the field such as Andreas Trumpp <a href="/hi_stem_lab/">HI-STEM - Cancer and Stem Cells in Heidelberg</a> , <a href="/rosslevinemd/">Ross Levine</a> , <a href="/Goodell_Lab/">Peggy Goodell</a> , <a href="/SignerLab/">Robert Signer</a> and many other presented their impressive science!!🤯

What a better way to start the meeting! 🤓
Joachim Schork (@joachimschork) 's Twitter Profile Photo

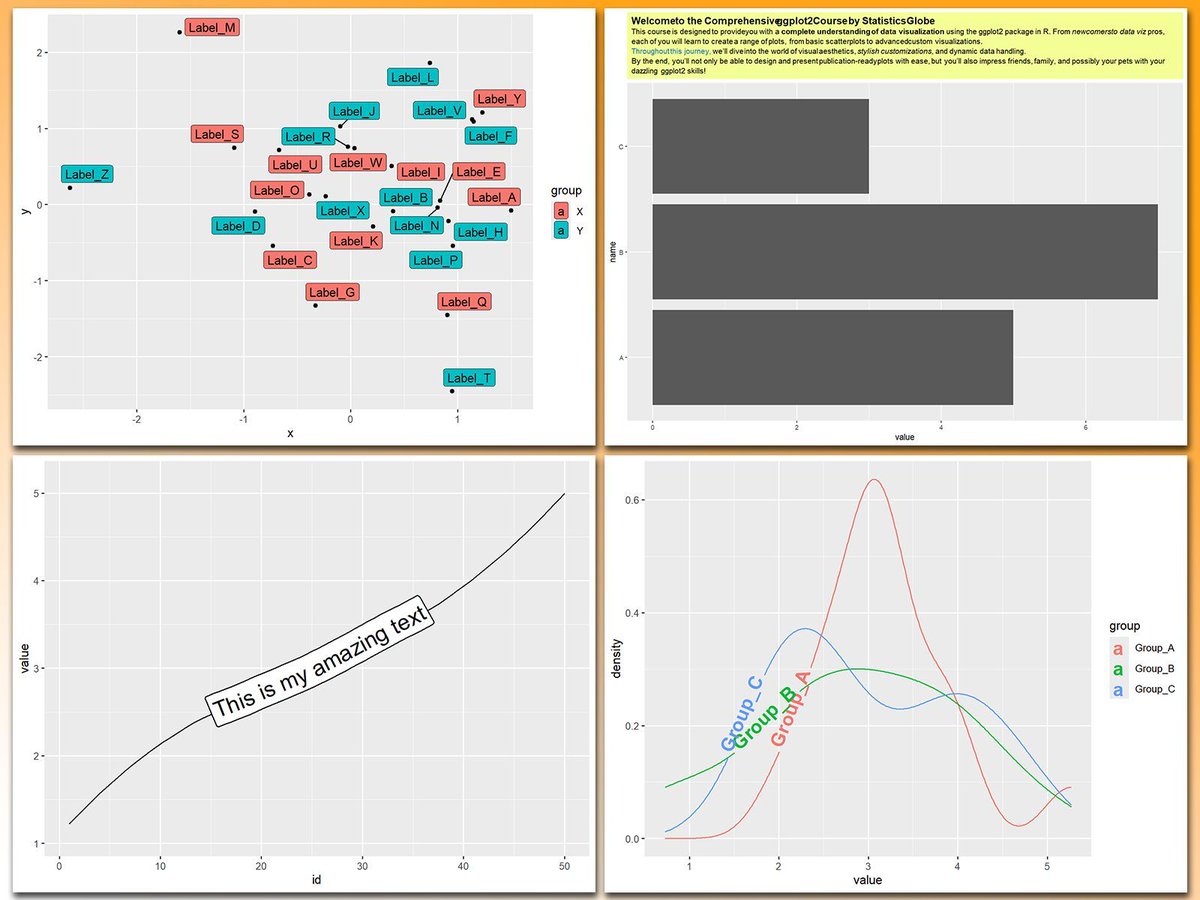
Working with text in ggplot2 plots can be a mess, especially when dealing with overlapping labels, busy backgrounds, or the need for custom formatting. Thankfully, several powerful ggplot2 extensions make text manipulation and annotation much easier and more effective. These are

Working with text in ggplot2 plots can be a mess, especially when dealing with overlapping labels, busy backgrounds, or the need for custom formatting. Thankfully, several powerful ggplot2 extensions make text manipulation and annotation much easier and more effective.

These are
antisense. (@razoralign) 's Twitter Profile Photo

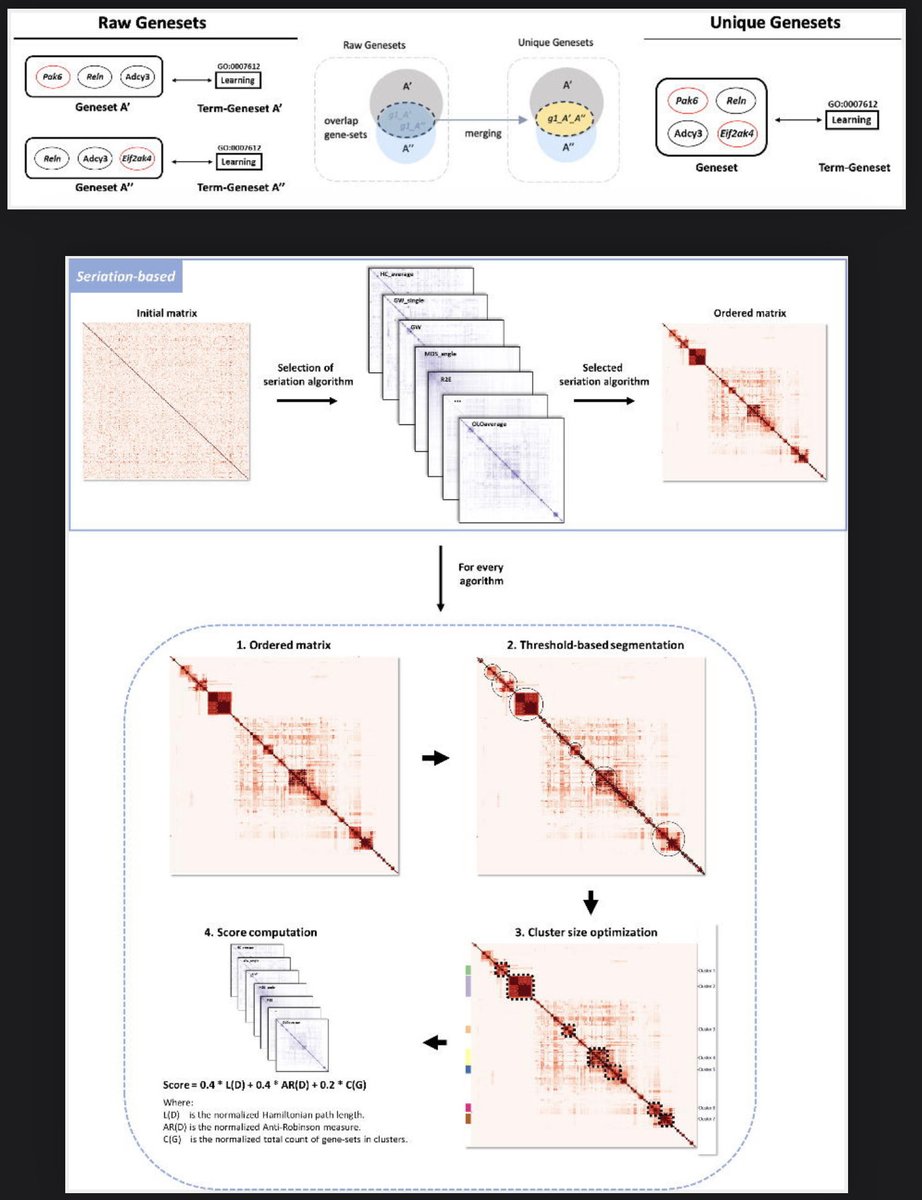
GeneSetCluster 2.0: a comprehensive toolset for summarizing and integrating gene-sets analysis biorxiv.org/content/10.110…

GeneSetCluster 2.0: a comprehensive toolset for summarizing and integrating gene-sets analysis biorxiv.org/content/10.110…
Ming "Tommy" Tang (@tangming2005) 's Twitter Profile Photo

I hope you've found this post helpful. Follow me for more. Subscribe to my FREE newsletter divingintogeneticsandgenomics.ck.page/profile

Alistair Forrest (@al__forrest) 's Twitter Profile Photo

Wow head-to-head comparison Visium HD FFPE, CosMx 6K, Xenium 5K, Stereo-seq v1.3 and Visium HD FF profiling on HGSOC and HCC. Heads-up GESTALT hopefully can save community some $$$$

Mick Milsom (@milsommick) 's Twitter Profile Photo

Check out our new review published in ISEH journal Experimental Hematology, asking the question: to what degree is HSC dysfunction responsible for hematologic aging exphem.org/article/S0301-… written by Fenia Fotopoulou Charles Dussiau Esther Rodriguez Correa Elsevier Hematology

Esther Rodriguez Correa (@esther_rcorrea) 's Twitter Profile Photo

Very happy to see our review on hematopoietic aging published in ISEH Journal of Experimental Hematology! It was so much fun to write this with my office mates Fenia Fotopoulou and Charles Dussiau

Joachim Schork (@joachimschork) 's Twitter Profile Photo

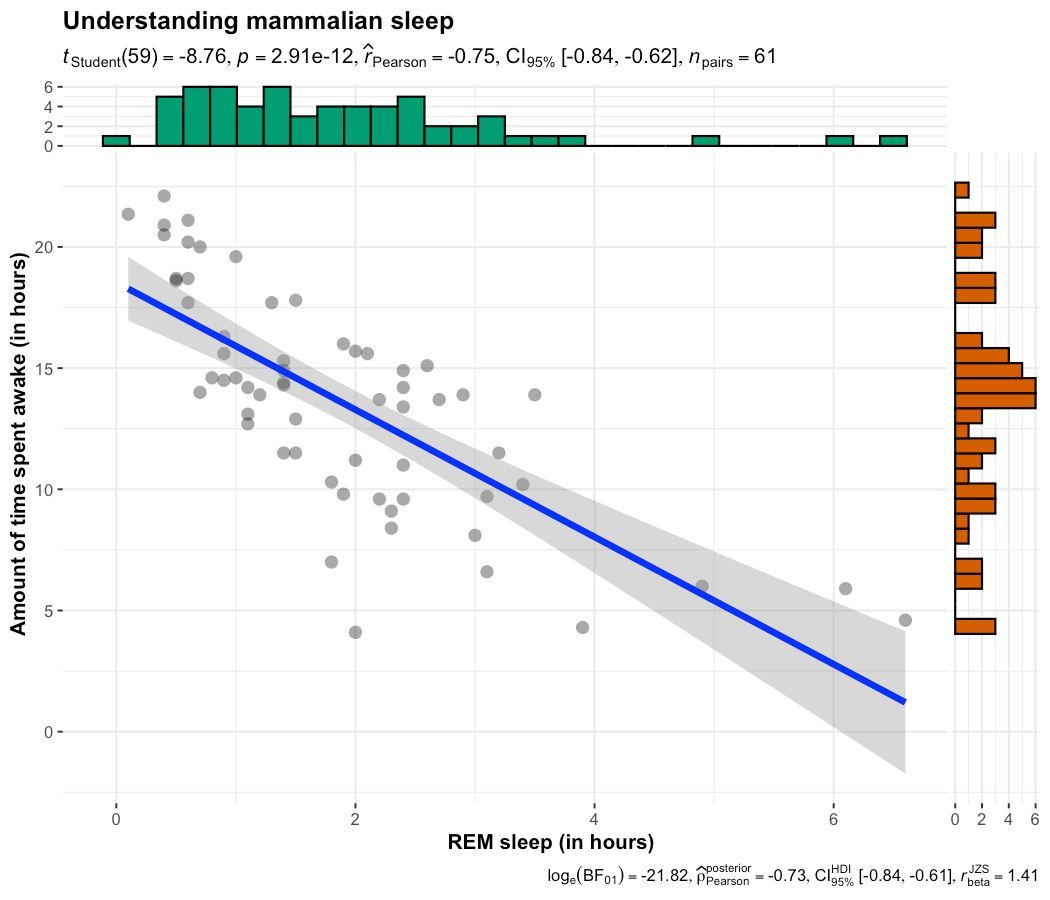
Need to explore relationships between variables while showing statistical insights? The ggscatterstats() function from the ggstatsplot package is your go-to tool. It combines scatterplots with marginal distributions, giving a comprehensive view of your data along with key

Need to explore relationships between variables while showing statistical insights? The ggscatterstats() function from the ggstatsplot package is your go-to tool. It combines scatterplots with marginal distributions, giving a comprehensive view of your data along with key
Joachim Schork (@joachimschork) 's Twitter Profile Photo

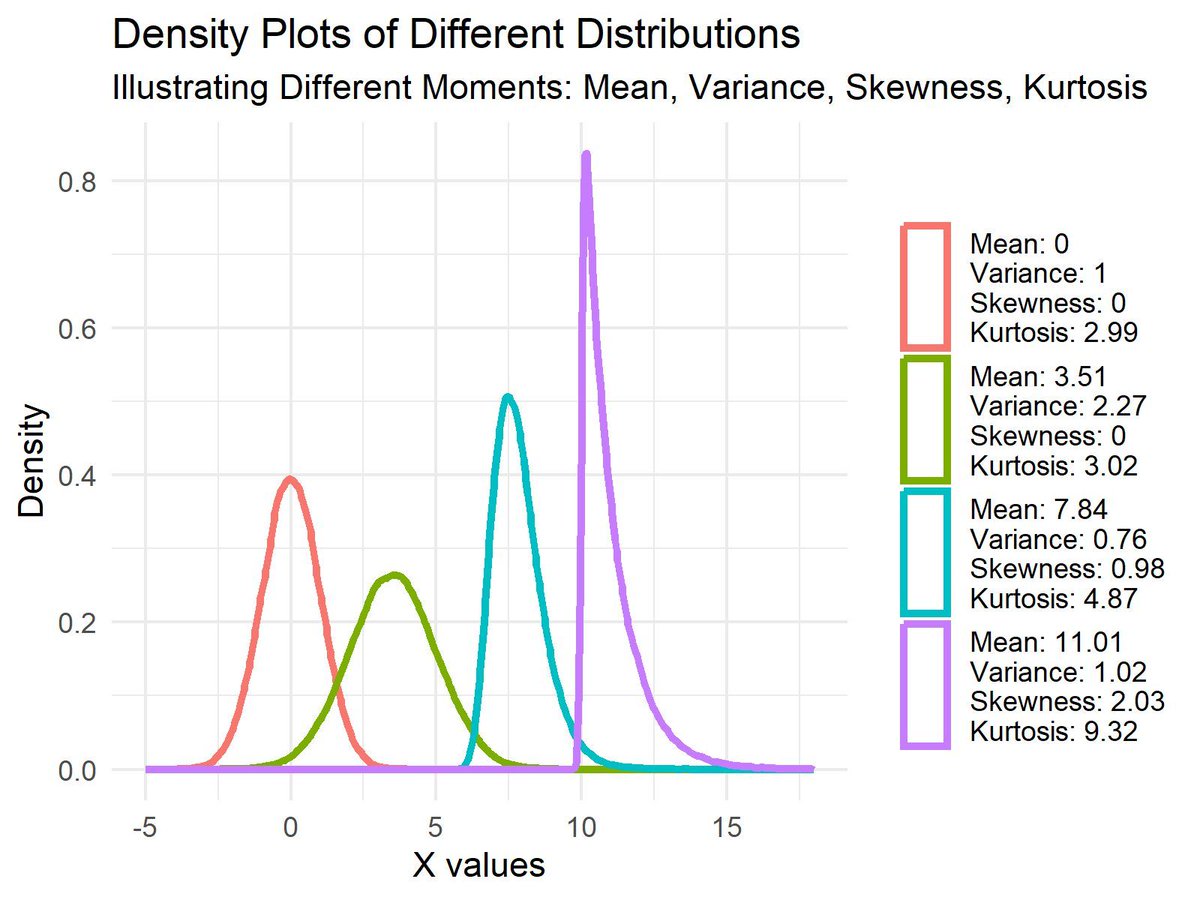
The four moments in statistics — mean, variance, skewness, and kurtosis — are essential for understanding the shape and behavior of data distributions. Each moment provides unique insights that help us analyze and interpret data more effectively. Understanding the Four Moments:

The four moments in statistics — mean, variance, skewness, and kurtosis — are essential for understanding the shape and behavior of data distributions. Each moment provides unique insights that help us analyze and interpret data more effectively.

Understanding the Four Moments:
shouwen wang (@shouwenw) 's Twitter Profile Photo

Want to trace cell division histories in humans without gene editing? Here we develop MethylTree Nature Methods to use epimutations on DNA methylation for accurate lineage tracing across cell types, developmental stages and species. nature.com/articles/s4159…