Erwan Rivault (@erwanrivault) 's Twitter Profile
Erwan Rivault

@erwanrivault

Data visualisation designer @BBCNews | previously @ESA_EO

ID: 1171647271928307712

calendar_today11-09-2019 04:51:19

476 Tweet

1,1K Followers

1,1K Following

Erwan Rivault (@erwanrivault) 's Twitter Profile Photo

Hurricane Beryl became the earliest Category 5 storm on record in the Atlantic, fuelled by warm sea temperatures. It is expected to pass south of Jamaica and then towards the Yucatán Peninsula. bbc.co.uk/news/articles/…

Hurricane Beryl became the earliest Category 5 storm on record in the Atlantic, fuelled by warm sea temperatures.

It is expected to pass south of Jamaica and then towards the Yucatán Peninsula.

bbc.co.uk/news/articles/…
Erwan Rivault (@erwanrivault) 's Twitter Profile Photo

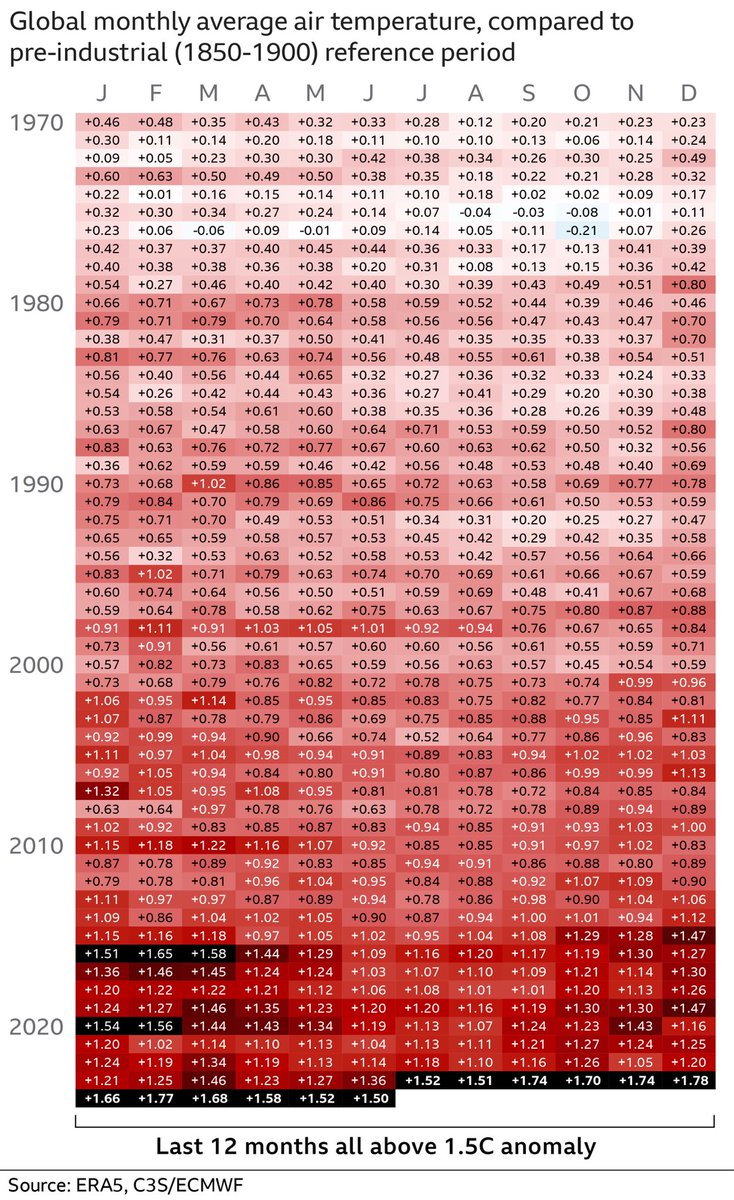
Each of the past 12 months was over 1.5C above pre-industrial levels, inching us closer towards breaking the Paris agreement The blocks in the heat map show the temperature anomaly for each month since 1970 Where they are black, the month breached 1.5C

Each of the past 12 months was over 1.5C above pre-industrial levels, inching us closer towards breaking the Paris agreement

The blocks in the heat map show the temperature anomaly for each month since 1970

Where they are black, the month breached 1.5C
Jonathan Amos (@jcdamos) 's Twitter Profile Photo

What connects the world's biggest iceberg and the Manhattan Project? The answer is G I Taylor, the Cambridge fluid dynamics pioneer who worked on the Trinity bomb and whose study of ocean behaviour explains the big berg's current predicament. bbc.co.uk/news/articles/…

Mark Bryson (@mark_bryson) 's Twitter Profile Photo

🚨 BBC News is #hiring for a #dataviz #designer/reporter to play a crucial role in transforming complex data into compelling visual stories that inform and engage our global audiences across platforms. Flexible, hybrid working (London) - apply by 6 Oct careers.bbc.co.uk/job/London-Dat…

🚨 BBC News is #hiring  for a  #dataviz #designer/reporter to play a crucial role in transforming complex data into compelling visual stories that inform and engage our global audiences across platforms. Flexible, hybrid working (London) - apply by 6 Oct 
careers.bbc.co.uk/job/London-Dat…
Erwan Rivault (@erwanrivault) 's Twitter Profile Photo

How unusual has this hurricane season been? We've had a look at the data so far, and at warmer than usual ocean temperatures in the Main Development Region, this part of the Atlantic where hurricanes form bbc.com/news/articles/… With Mark Poynting Becky Dale & Libby Rogers

How unusual has this hurricane season been?

We've had a look at the data so far, and at warmer than usual ocean temperatures in the Main Development Region, this part of the Atlantic where hurricanes form

bbc.com/news/articles/…

With <a href="/MarkPoynting/">Mark Poynting</a> <a href="/becky_dale/">Becky Dale</a> &amp; Libby Rogers
Erwan Rivault (@erwanrivault) 's Twitter Profile Photo

New analysis of Sentinel-1 radar satellite images by corey scher & Jamon Van Den Hoek reveals damaged areas across Lebanon following Israeli bombing. Southern Lebanon has been particularly targeted, as well as Dahieh, a suburb of Beirut. More maps in our story: bbc.co.uk/news/articles/…

New analysis of Sentinel-1 radar satellite images by
<a href="/coreymaps/">corey scher</a> &amp; <a href="/JamonVDH/">Jamon Van Den Hoek</a> reveals damaged areas across Lebanon following Israeli bombing. 

Southern Lebanon has been particularly targeted, as well as Dahieh, a suburb of Beirut.

More maps in our story: bbc.co.uk/news/articles/…
Erwan Rivault (@erwanrivault) 's Twitter Profile Photo

#30DayMapChallenge Day 5: A Journey Only 5 days away from the start of the 2024-25 Vendée Globe sailing race, I mapped the tracks of the 33 competitors from the last edition in 2020-21.
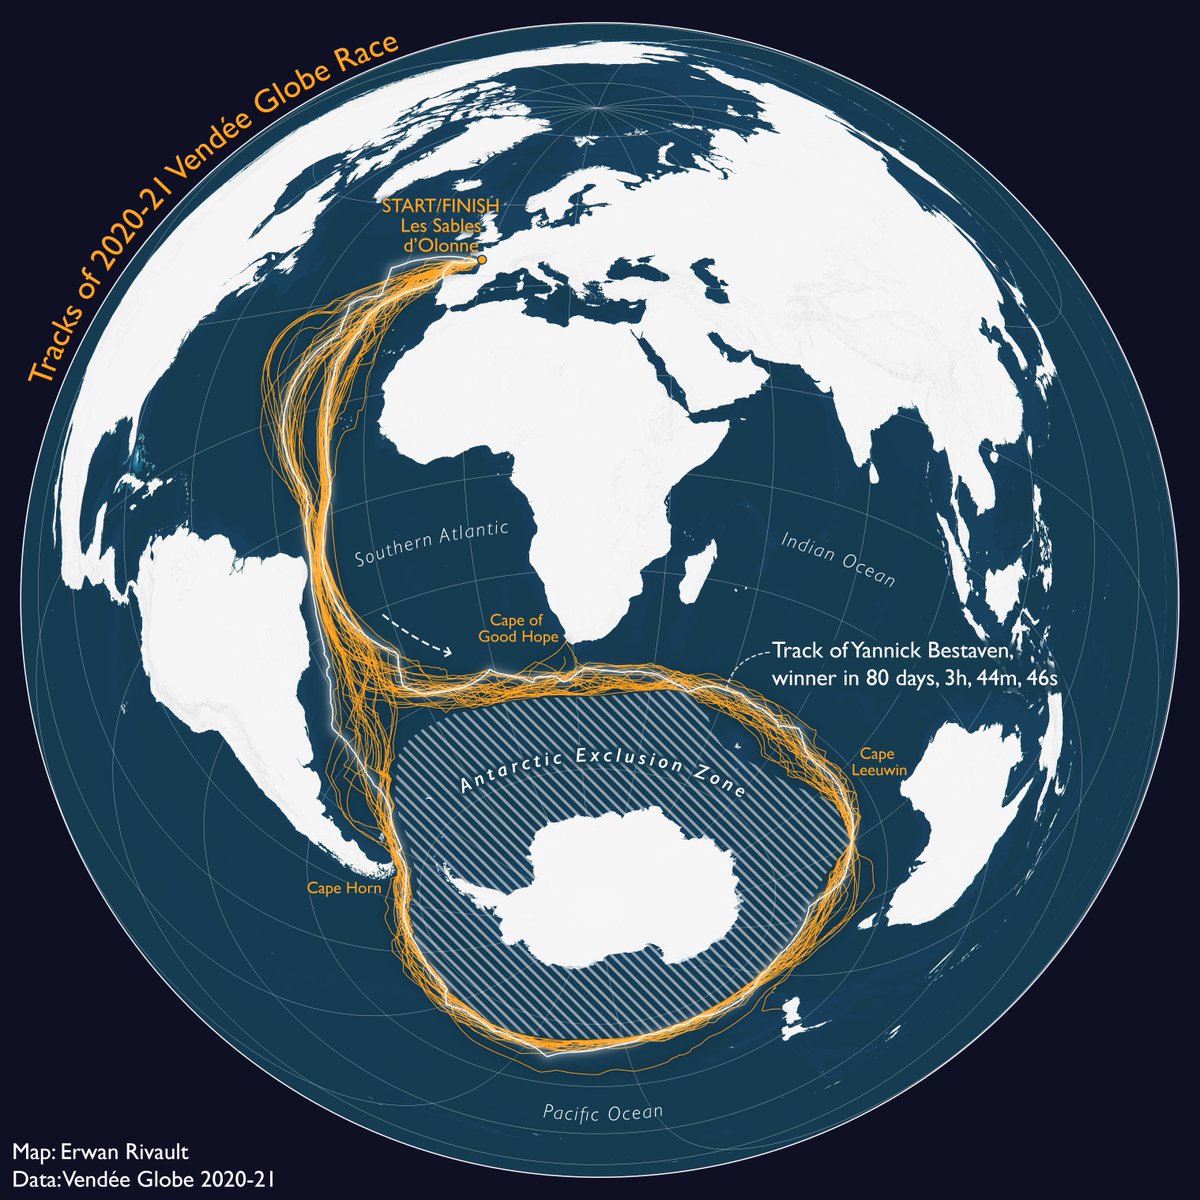
#30DayMapChallenge Day 5: A Journey

Only 5 days away from the start of the 2024-25 <a href="/VendeeGlobe/">Vendée Globe</a> sailing race, I mapped the tracks of the 33 competitors from the last edition in 2020-21.
Erwan Rivault (@erwanrivault) 's Twitter Profile Photo

#30DayMapChallenge Day 11: Arctic One year of MODIS daily mosaic images Did you know optical satellites usually don’t capture data over the poles in winter due to lack of sunlight? The "no data" hole grows as we near the winter solstice, and starts closing once daylight returns

Stephen Kennedy (@oh_sk) 's Twitter Profile Photo

#30DayMapChallenge | Day 15 My Data | Every Door in Dudgeon-Monroe Spent our early summer walks surveying the door color of 1100+ houses in our hood. Hope it inspires more vibrant paint color combos in your neighborhood! See the full map as a print! latlong.shop/products/every…

#30DayMapChallenge | Day 15 My Data | Every Door in Dudgeon-Monroe

Spent our early summer walks surveying the door color of 1100+ houses in our hood. Hope it inspires more vibrant paint color combos in your neighborhood! 

See the full map as a print!
latlong.shop/products/every…
Aaron Koelker (@aaronkoelker) 's Twitter Profile Photo

This animation I made for a recent project shows the changes in ice extent over North America since the last glacial maximum (roughly 18k years). Each frame was hand-drawn using Procreate.