Global Economic (@globalseconomic) 's Twitter Profile
Global Economic

@globalseconomic

Global, Asia and Middle East (Iran, Russia, Saudi Arabia, Turkey, and UAE) Economy, Markets and Trade Research, Analysis and Statistics.

ID: 1568271069588463621

calendar_today09-09-2022 16:12:25

1,1K Tweet

3,3K Followers

2,2K Following

Econovis (@econovisuals) 's Twitter Profile Photo

📈 S&P 500 Market Cap Reaches Record $54.9 Trillion Amid Easing Global Tensions As of June 27, 2025, the S&P 500’s total market capitalization reached a record high of $54.9 trillion, fueled by easing trade tensions and improved geopolitical stability. This milestone marks a

📈 S&P 500 Market Cap Reaches Record $54.9 Trillion Amid Easing Global Tensions

As of June 27, 2025, the S&P 500’s total market capitalization reached a record high of $54.9 trillion, fueled by easing trade tensions and improved geopolitical stability. This milestone marks a
Econovis (@econovisuals) 's Twitter Profile Photo

📈 U.S. M2 Money Supply Hits Record $21.9 Trillion in May 2025 The U.S. M2 money supply—comprising cash, checking deposits, and other liquid assets—rose to a record $21.94 trillion (seasonally adjusted) in May 2025, up 4.5% year-over-year. Although below the long-term average

📈 U.S. M2 Money Supply Hits Record $21.9 Trillion in May 2025

The U.S. M2 money supply—comprising cash, checking deposits, and other liquid assets—rose to a record $21.94 trillion (seasonally adjusted) in May 2025, up 4.5% year-over-year. Although below the long-term average
Econovis (@econovisuals) 's Twitter Profile Photo

📈 Modest U.S. Stock Market Growth Amid Strong Global Gains in First Half of 2025 According to S&P Global, U.S. stock market capitalization rose by a modest 4.7% between December 2024 and June 2025. In contrast, global markets gained an average of 12.2%, with most other major

📈 Modest U.S. Stock Market Growth Amid Strong Global Gains in First Half of 2025

According to S&P Global, U.S. stock market capitalization rose by a modest 4.7% between December 2024 and June 2025. In contrast, global markets gained an average of 12.2%, with most other major
The Kobeissi Letter (@kobeissiletter) 's Twitter Profile Photo

BREAKING: The US M2 money supply jumped +4.5% Y/Y in May, to a record $21.94 trillion. This marks the 19th consecutive monthly increase. It has now surpassed the previous all-time high of $21.86 trillion, posted in March 2022. Furthermore, inflation-adjusted M2 money supply

BREAKING: The US M2 money supply jumped +4.5% Y/Y in May, to a record $21.94 trillion.

This marks the 19th consecutive monthly increase.

It has now surpassed the previous all-time high of $21.86 trillion, posted in March 2022.

Furthermore, inflation-adjusted M2 money supply
Econovis (@econovisuals) 's Twitter Profile Photo

📈 Global Leaders in Manufactured Goods Trade (2024) In 2024, China dominated global manufactured goods trade with $3.26 trillion in exports and $1.33 trillion in imports, resulting in a total trade volume of $4.59 trillion and a substantial trade surplus. The United States

📈 Global Leaders in Manufactured Goods Trade (2024)

In 2024, China dominated global manufactured goods trade with $3.26 trillion in exports and $1.33 trillion in imports, resulting in a total trade volume of $4.59 trillion and a substantial trade surplus. The United States
Econovis (@econovisuals) 's Twitter Profile Photo

📈 U.S. Stock Market Capitalization More Than Doubled from 2015 to 2025, Driven by Big Tech From May 2015 to May 2025, total U.S. stock market capitalization rose 128%, growing from $27.1 trillion to $61.6 trillion—a $34.6 trillion increase. Over the same period, the combined

📈 U.S. Stock Market Capitalization More Than Doubled from 2015 to 2025, Driven by Big Tech

From May 2015 to May 2025, total U.S. stock market capitalization rose 128%, growing from $27.1 trillion to $61.6 trillion—a $34.6 trillion increase. Over the same period, the combined
Econovis (@econovisuals) 's Twitter Profile Photo

📈 Manufactured Goods Net Exports (2024) In 2024, China recorded the world’s highest net exports of manufactured goods at $1,929 billion, underscoring its dominant position in global manufacturing trade. Germany followed with a surplus of $373 billion, while other major Asian

📈 Manufactured Goods Net Exports (2024)

In 2024, China recorded the world’s highest net exports of manufactured goods at $1,929 billion, underscoring its dominant position in global manufacturing trade. Germany followed with a surplus of $373 billion, while other major Asian
Voronoi (@voronoiapp) 's Twitter Profile Photo

June Editor's Choice ⭐ Economist Econovis broke down why the Strait of Hormuz no longer holds the same power over the West. Dive into the analysis on Voronoi: voronoiapp.com/geopolitics/-T…

Econovis (@econovisuals) 's Twitter Profile Photo

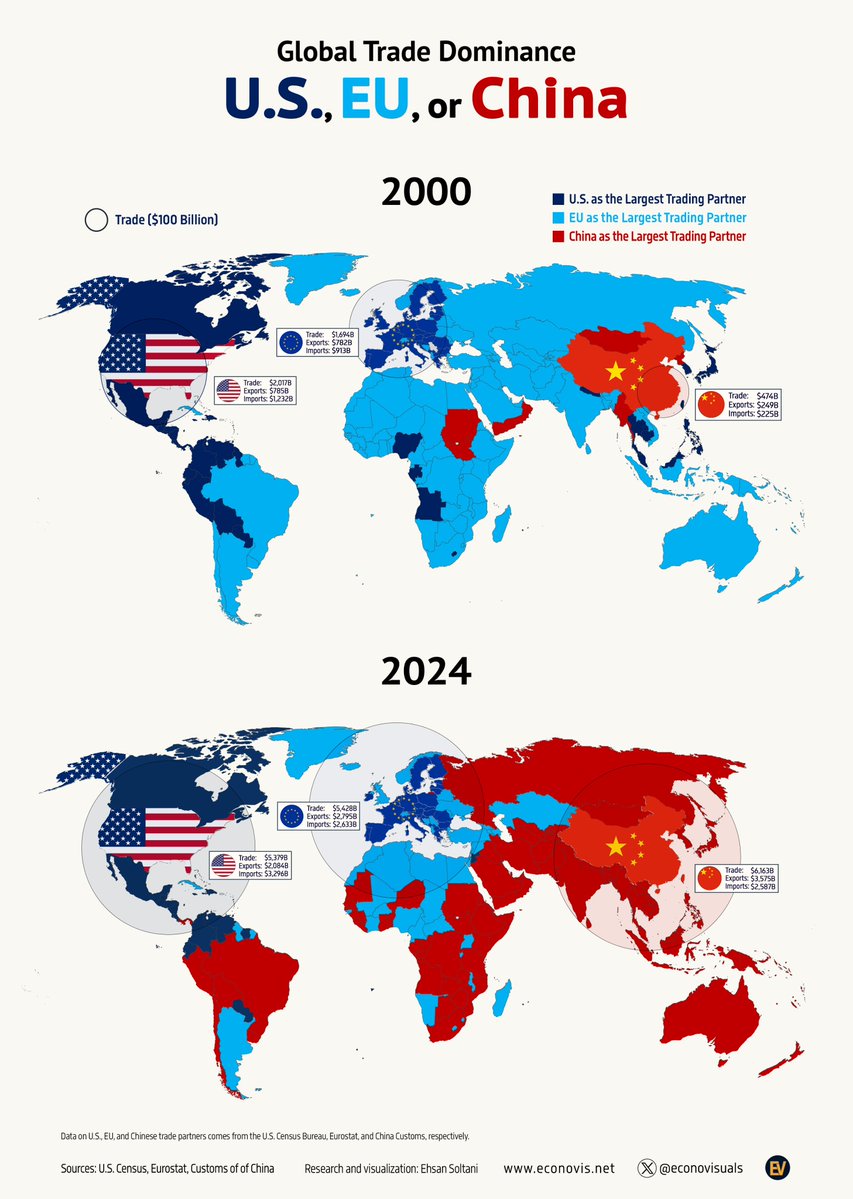
📈 Global Trade Dominance: U.S., EU, or China (2000 vs. 2024) This dual world map compares global trade dominance by identifying the largest trading partner (combined exports and imports) for each country in the years 2000 and 2024—among the United States, European Union, and

📈 Global Trade Dominance: U.S., EU, or China (2000 vs. 2024)

This dual world map compares global trade dominance by identifying the largest trading partner (combined exports and imports) for each country in the years 2000 and 2024—among the United States, European Union, and
EndGame Macro (@onechancefreedm) 's Twitter Profile Photo

This powerful visual by Econovis (worth the follow) illustrates the long arc of global trade dominance and the structural consequences of the U.S. dollar’s role as the world’s reserve currency. In 2000, the U.S. was the top trading partner for most of the world. But by 2024,

This powerful visual by <a href="/econovisuals/">Econovis</a> (worth the follow) illustrates the long arc of global trade dominance and the structural consequences of the U.S. dollar’s role as the world’s reserve currency. In 2000, the U.S. was the top trading partner for most of the world. But by 2024,
Voronoi (@voronoiapp) 's Twitter Profile Photo

How have Federal Reserve assets changed over time? 🏦 @Econovisuals charts their performance from 2002 to 2025: voronoiapp.com/money/-Federal…

How have Federal Reserve assets changed over time? 🏦

@Econovisuals charts their performance from 2002 to 2025: voronoiapp.com/money/-Federal…
Econovis (@econovisuals) 's Twitter Profile Photo

📈 U.S. Stock Market Diverges Sharply from Rest of World Since 2018 Since 2018, the U.S. stock market has significantly outpaced the rest of the world, breaking from a long-standing pattern of global market correlation. Fueled by the rapid rise of major U.S. technology firms,

📈 U.S. Stock Market Diverges Sharply from Rest of World Since 2018

Since 2018, the U.S. stock market has significantly outpaced the rest of the world, breaking from a long-standing pattern of global market correlation. Fueled by the rapid rise of major U.S. technology firms,
Econovis (@econovisuals) 's Twitter Profile Photo

📈 Global Crude Oil Production (2024) Global crude oil and condensate production reached 82.8 million barrels per day in 2024, with the United States leading as the world’s top producer at 13.2 million barrels per day. Russia followed with 10.2 million, and Saudi Arabia ranked

📈 Global Crude Oil Production (2024)

Global crude oil and condensate production reached 82.8 million barrels per day in 2024, with the United States leading as the world’s top producer at 13.2 million barrels per day. Russia followed with 10.2 million, and Saudi Arabia ranked
Econovis (@econovisuals) 's Twitter Profile Photo

📈 U.S. Top Ten Stocks vs. Global Stock Markets (June 2025) As of June 2025, the top 10 U.S. stocks—led by giants such as Nvidia, Microsoft, Apple, Amazon, Alphabet, and Meta—collectively reached a market capitalization of $21.08 trillion, exceeding the total value of the entire

📈 U.S. Top Ten Stocks vs. Global Stock Markets (June 2025)

As of June 2025, the top 10 U.S. stocks—led by giants such as Nvidia, Microsoft, Apple, Amazon, Alphabet, and Meta—collectively reached a market capitalization of $21.08 trillion, exceeding the total value of the entire
Econovis (@econovisuals) 's Twitter Profile Photo

📈 U.S.–Canada Economic Ties: $30B Non-Fuel Trade Surplus & $2.7T Canadian Investment in U.S. Assets In 2024, U.S. non-fuel trade with Canada totaled $612 billion—comprising $321 billion in exports and $291 billion in imports—resulting in a $30 billion surplus. Yet in early

📈 U.S.–Canada Economic Ties: $30B Non-Fuel Trade Surplus &amp; $2.7T Canadian Investment in U.S. Assets

In 2024, U.S. non-fuel trade with Canada totaled $612 billion—comprising $321 billion in exports and $291 billion in imports—resulting in a $30 billion surplus. Yet in early
Econovis (@econovisuals) 's Twitter Profile Photo

📈 Fed’s Three-Year Tightening: $2.3 Trillion Roll-Off Slows in Q2 2025 After surging to $8.94 trillion in 2022, the Fed’s balance sheet fell by 25% as Quantitative Tightening entered its 39th month—though the pace of contraction is easing. 🧾 Overview Following its aggressive
📈 Fed’s Three-Year Tightening: $2.3 Trillion Roll-Off Slows in Q2 2025

After surging to $8.94 trillion in 2022, the Fed’s balance sheet fell by 25% as Quantitative Tightening entered its 39th month—though the pace of contraction is easing.

🧾 Overview

Following its aggressive
Econovis (@econovisuals) 's Twitter Profile Photo

📈 Global Natural Gas Production (2024) In 2024, global natural gas production reached 398 billion cubic feet per day. The United States led by a wide margin, producing nearly 100 billion cubic feet per day—more than the next two largest producers combined. Russia followed with

📈 Global Natural Gas Production (2024)

In 2024, global natural gas production reached 398 billion cubic feet per day. The United States led by a wide margin, producing nearly 100 billion cubic feet per day—more than the next two largest producers combined. Russia followed with
Econovis (@econovisuals) 's Twitter Profile Photo

📈 U.S. Job Growth Concentrated in Health, Government, and Services; Manufacturing Jobs Decline in H1 2025 Of the 782,000 non-farm jobs added in the first half of 2025, 69% were in health care & social assistance and government. An additional 21% came from leisure & hospitality,

📈 U.S. Job Growth Concentrated in Health, Government, and Services; Manufacturing Jobs Decline in H1 2025

Of the 782,000 non-farm jobs added in the first half of 2025, 69% were in health care &amp; social assistance and government. An additional 21% came from leisure &amp; hospitality,
Econovis (@econovisuals) 's Twitter Profile Photo

📈 China Trade Surplus Surges to Record $1.14 Trillion in June 2025 (LTM) China’s trade surplus soared 32.7% year-over-year, reaching a record $1.14 trillion in the twelve months ended June 2025. Since the onset of the U.S.-China trade war in 2018, the surplus has

📈 China Trade Surplus Surges to Record $1.14 Trillion in June 2025 (LTM)

China’s trade surplus soared 32.7% year-over-year, reaching a record $1.14 trillion in the twelve months ended June 2025. Since the onset of the U.S.-China trade war in 2018, the surplus has
Econovis (@econovisuals) 's Twitter Profile Photo

📈 U.S. Big 3 Tech Market Cap Hits Record $11.0 Trillion As of July 15, 2025, the combined market capitalization of the U.S. Big 3 tech companies—Apple, Microsoft, and Nvidia—reached a record $11.05 trillion. Since 2000, their market cap has grown at a compound annual growth

📈 U.S. Big 3 Tech Market Cap Hits Record $11.0 Trillion

As of July 15, 2025, the combined market capitalization of the U.S. Big 3 tech companies—Apple, Microsoft, and Nvidia—reached a record $11.05 trillion. Since 2000, their market cap has grown at a compound annual growth