Tobias Carlisle (@greenbackd) 's Twitter Profile
Tobias Carlisle

@greenbackd

PM, Acquirers Funds® acquirersfunds.com. Author, The Acquirer's Multiple (amzn.to/2ij8q4U) and Deep Value (amzn.to/2iibcHu).

ID: 20119344

linkhttp://www.acquirersmultiple.com calendar_today05-02-2009 04:05:38

22,22K Tweet

66,66K Followers

1,1K Following

Dave Collum (@davidbcollum) 's Twitter Profile Photo

Starting a podcast with 🥦 Jake Taylor 🎉 and Tobias Carlisle. Camera is on but I am getting my headphones. My wife walks in front of my laptop almost naked and one of them says, "Pants optional?"

Tobias Carlisle (@greenbackd) 's Twitter Profile Photo

The S&P 500 trades at a significant forward P/E premium to both mid-cap and small-cap indices. S&P 500 at 21.2x S&P 400 at 15.5x S&P 600 at 14.7x This represents a 37% valuation premium for large-caps over mid-caps and 45% over small-caps.

The S&P 500 trades at a significant forward P/E premium to both mid-cap and small-cap indices.

S&P 500 at 21.2x
S&P 400 at 15.5x
S&P 600 at 14.7x 

This represents a 37% valuation premium for large-caps over mid-caps and 45% over small-caps.
Tobias Carlisle (@greenbackd) 's Twitter Profile Photo

This is the Russell 2000 v S&P 500. When the red and black line is going up, the Russell 2000 is outperforming the S&P 500. When the red and black line is going down, the Russell 2000 is underperforming the S&P 500. The red and black line peaked in 2011 and fell to an

This is the Russell 2000 v S&P 500. 

When the red and black line is going up, the Russell 2000 is outperforming the S&P 500.

When the red and black line is going down, the Russell 2000 is underperforming the S&P 500.

The red and black line peaked in 2011 and fell to an
Tobias Carlisle (@greenbackd) 's Twitter Profile Photo

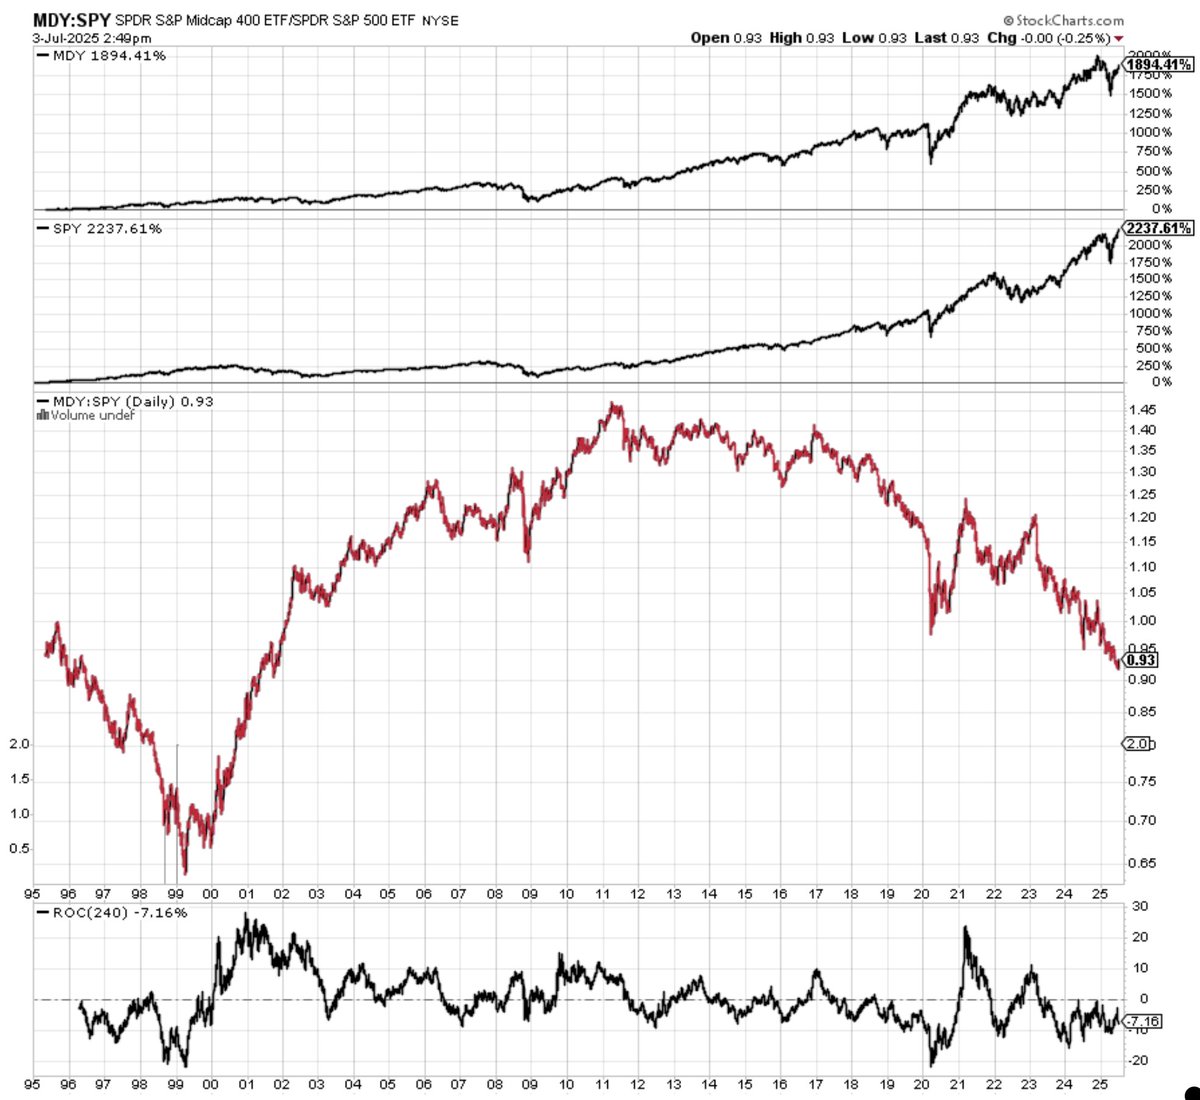
This is the S&P 400 (mid cap) v S&P 500. When the red and black line is going up, the S&P 400 is outperforming the S&P 500. When the red and black line is going down, the S&P 400 is underperforming the S&P 500. The red and black line peaked in 2011 and fell to a new low

This is the S&P 400 (mid cap) v S&P 500.   

When the red and black line is going up, the S&P 400 is outperforming the S&P 500.  

When the red and black line is going down, the S&P 400 is underperforming the S&P 500.  

The red and black line peaked in 2011 and fell to a new low
TheStockBro (@thestockbro) 's Twitter Profile Photo

$AMR $EIX $PCG $OKLO $CEG $GE $GEV $VST $TLN $TSLA $AMZN $SPY $VOO $T Tobias Carlisle Hari Ramachandra Stig T. Brodersen Mohnish Pabrai Pabrai Wagons Fund Undervalued Stock: Alpha Metallurgical $AMR 🪨🪨🪨 "If we're going to have Green Infrastructure, we need Met Coal. So the demand picture for

$AMR $EIX $PCG $OKLO $CEG $GE $GEV $VST $TLN $TSLA $AMZN $SPY $VOO $T <a href="/Greenbackd/">Tobias Carlisle</a> <a href="/harirama/">Hari Ramachandra</a> <a href="/stig_brodersen/">Stig T. Brodersen</a> <a href="/MohnishPabrai/">Mohnish Pabrai</a> <a href="/wagonsfund/">Pabrai Wagons Fund</a>

Undervalued Stock: Alpha Metallurgical
$AMR 🪨🪨🪨

"If we're going to have Green Infrastructure, we need Met Coal. So the demand picture for
Tobias Carlisle (@greenbackd) 's Twitter Profile Photo

“One of the bad things [about value] is it’s been historically one of the streakier factors… but their paper says on average the streakier factors also make you more money.” Clifford Asness

Tobias Carlisle (@greenbackd) 's Twitter Profile Photo

Small caps and midcaps are 30% cheaper than large caps on a price-earnings ratio and have been since 2022--3 1/2 years. The last time we saw a discount this size was 1998 to 2001. A legendary small / mid cap cycle followed to 2017/18.

Small caps and midcaps are 30% cheaper than large caps on a price-earnings ratio and have been since 2022--3 1/2 years. 

The last time we saw a discount this size was 1998 to 2001. A legendary small / mid cap cycle followed to 2017/18.