Harvey Motulsky (@hmotulsky) 's Twitter Profile
Harvey Motulsky

@hmotulsky

Founder of GraphPad Software. Author of the text Intuitive Biostatistics. Statistics Editor, Molecular Pharmacology.

ID: 88575804

calendar_today09-11-2009 02:53:45

205 Tweet

376 Followers

265 Following

Harvey Motulsky (@hmotulsky) 's Twitter Profile Photo

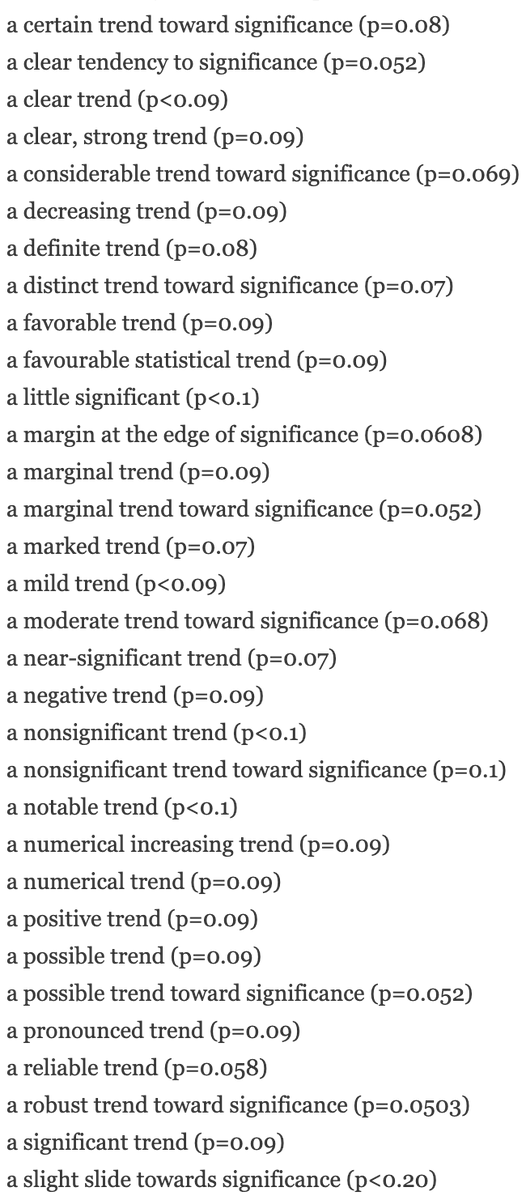
I agree totally. Ditto for the 500+ other ways to say the same thing. Here is the beginning of Hankins' list. mchankins.wordpress.com/2013/04/21/sti…

I agree totally. Ditto for the 500+ other ways to say the same thing. Here is the beginning of Hankins' list.

mchankins.wordpress.com/2013/04/21/sti…
Harvey Motulsky (@hmotulsky) 's Twitter Profile Photo

Prism 9 will only put the automatic "stars on graph" after you ran ANOVA and requested multiple comparison tests. Louise Topping compared each mean to every other mean. With 4 columns (groups), that is 6 follow-up tests. You asked about 7, but the screen video goes by fast.

Harvey Motulsky (@hmotulsky) 's Twitter Profile Photo

Good questions! Prism 9 only puts asterisks on the graph after you chose ANOVA and multiple comparison tests. Yes, multiple comparisons are accounted for, and actual (multiplicity adjusted) p-values are shown in the results table and can be placed on the graph instead of **.

Harvey Motulsky (@hmotulsky) 's Twitter Profile Photo

Please elaborate on your suggestion. When you choose ANOVA, GraphPad Software Prism asks you to specify which (if any) comparisons to make, and only selected comparisons will appear on the graph (and you can choose to label all comparisons or only those with P < 0.05).
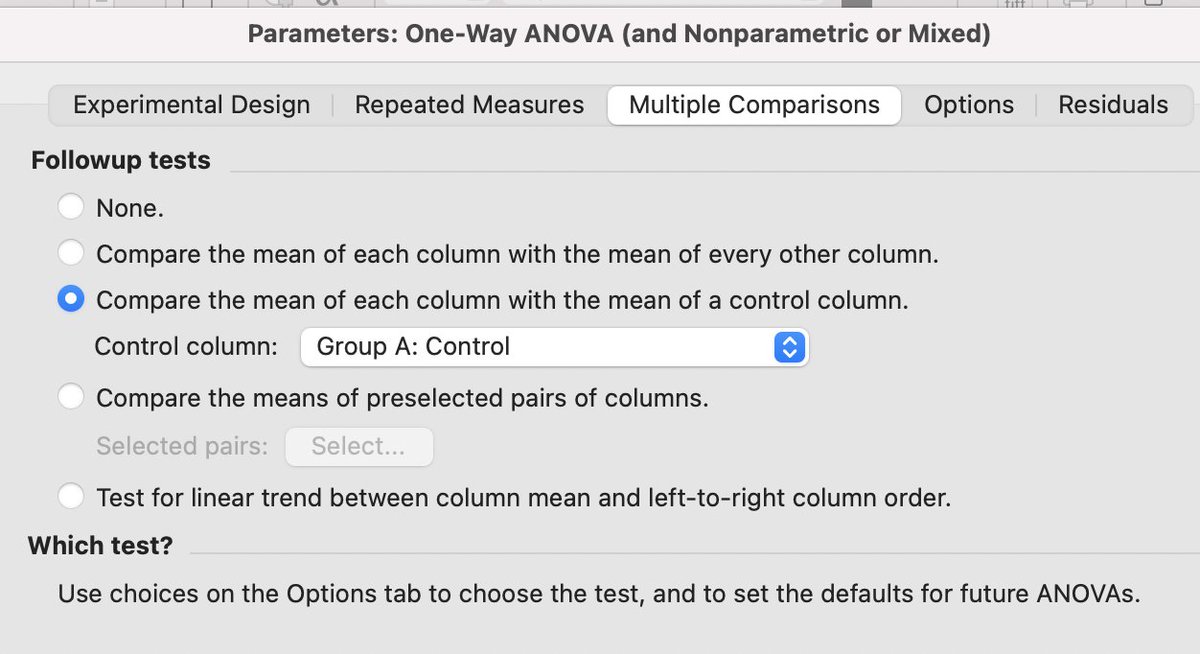
Please elaborate on your suggestion. When you choose ANOVA, <a href="/GraphPad/">GraphPad Software</a> Prism asks you to specify which (if any) comparisons to make, and only selected comparisons will appear on the graph (and you can choose to label all comparisons or only those with P &lt; 0.05).
Harvey Motulsky (@hmotulsky) 's Twitter Profile Photo

Correct! If you request fewer preselected comparisons (based on experimental design and questions, not based on seeing the data), the multiple comparison testing will have more power. I've passed along the suggestion to add wording to this effect on the dialog. Thanks!

Harvey Motulsky (@hmotulsky) 's Twitter Profile Photo

My Intuitive Biostatistics is now online for all Prism users. Update Prism to 9.1 and link to "Prism Academy" from the Welcome dialog. Set up an account for the Academy, which is part of your Prism license, and you'll have access to the book, videos, and more.

My Intuitive Biostatistics is now online for all Prism users. Update Prism to 9.1 and link to "Prism Academy" from the Welcome dialog.  Set up an account for the Academy, which is part of your Prism license, and you'll have access to the book, videos, and more.
Harvey Motulsky (@hmotulsky) 's Twitter Profile Photo

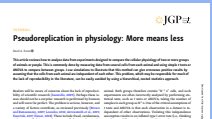
Eisner has written a great review/editorial about psuedoreplication, pointing out that triplicate values from triplicate animals is not the same as n=9. The solution is to run analyses that take into account nesting. rupress.org/jgp/article-pd…

Eisner has written a great review/editorial about psuedoreplication, pointing out that triplicate values from triplicate animals is not the same as n=9. The solution is to run analyses that take into account nesting.
rupress.org/jgp/article-pd…
Harvey Motulsky (@hmotulsky) 's Twitter Profile Photo

Vickers and colleagues have published a great set of guidelines for making graphs and tables. The guidelines were written for researchers in urology, but are general enough to apply to most fields, basic and clinical. auajournals.org/doi/pdf/10.109…

Vickers and colleagues have published a great set of guidelines for making graphs and tables. The guidelines were written for researchers in urology, but are general enough to apply to most fields, basic and clinical.
auajournals.org/doi/pdf/10.109…
Harvey Motulsky (@hmotulsky) 's Twitter Profile Photo

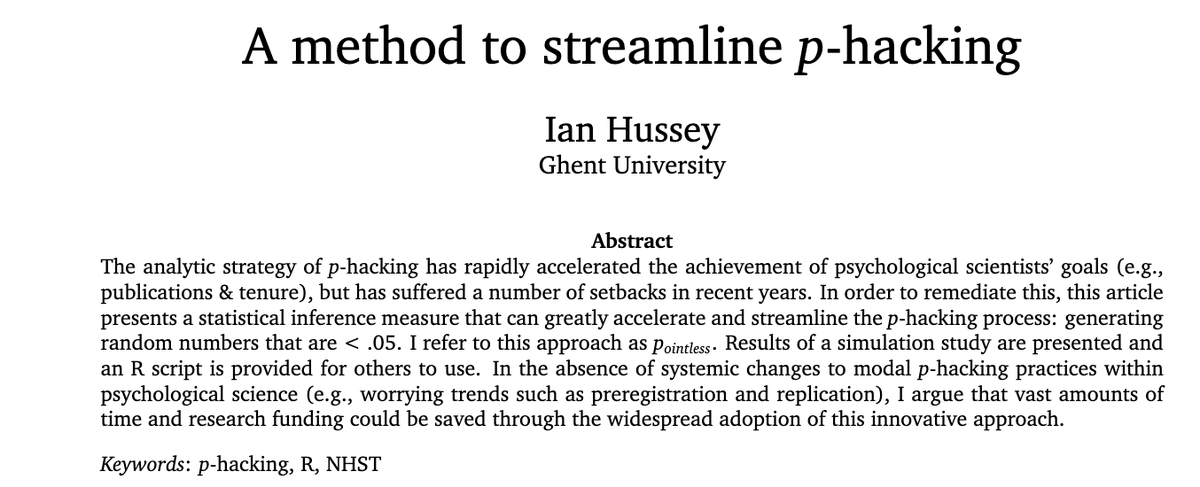
The perfect paper for April 1. Since low p-values don't mean very much, Hussey explains how to generate them more quickly. open.lnu.se/index.php/meta…

The perfect paper for April 1. Since low p-values don't mean very much, Hussey explains how to generate them more quickly. 
open.lnu.se/index.php/meta…
Harvey Motulsky (@hmotulsky) 's Twitter Profile Photo

"If the five years since the ASA's statement have shown anything, it is that the inferential virus of NHST (null hypothesis significance testing) is not going away any time soon."

Harvey Motulsky (@hmotulsky) 's Twitter Profile Photo

I’m glad you like my book! But I don’t use testing for “equivalence” and “noninferiority” interchangeably. I try to distinguish carefully. But they are both in the chapter title so I can see how someone might misinterpret.

Harvey Motulsky (@hmotulsky) 's Twitter Profile Photo

Lisa Motulsky crossed 8.2 MILE. Time 01:34:56, pace 11:35 min/mile, est. finish 11:46 am track.rtrt.me/e/SVE-BIGSUR-2… bsim

Harvey Motulsky (@hmotulsky) 's Twitter Profile Photo

Lisa Motulsky crossed 12 MILE. Time 02:06:46, pace 11:21 min/mile, est. finish 11:31 am track.rtrt.me/e/SVE-BIGSUR-2… bsim

Harvey Motulsky (@hmotulsky) 's Twitter Profile Photo

Lisa Motulsky crossed 21.2 MILE. Time 03:51:12, pace 11:22 min/mile, est. finish 11:40 am track.rtrt.me/e/SVE-BIGSUR-2… bsim

Harvey Motulsky (@hmotulsky) 's Twitter Profile Photo

Lisa Motulsky crossed 24 MILE. Time 04:22:20, pace 11:08 min/mile, est. finish 11:40 am track.rtrt.me/e/SVE-BIGSUR-2… bsim

Harvey Motulsky (@hmotulsky) 's Twitter Profile Photo

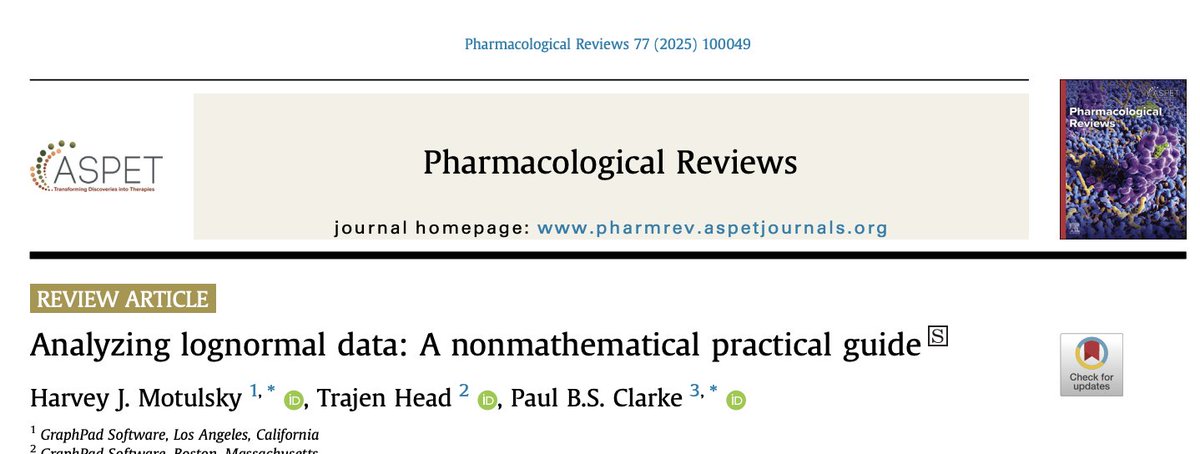
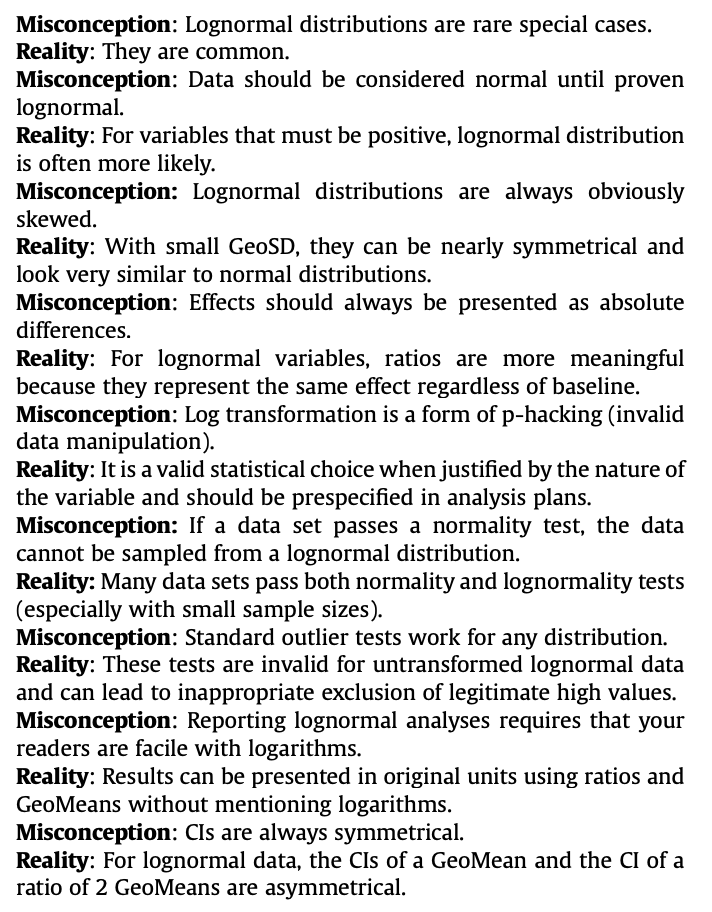
We recently published a review of lognormal distributions. It is long, but ends with a concise set of recommendations and a list of common misconceptions. And a poem! pharmrev.aspetjournals.org/action/showPdf…

We recently published a review of lognormal distributions. It is long, but ends with a concise set of recommendations and a list of common misconceptions. And a poem!
pharmrev.aspetjournals.org/action/showPdf…