Interactive Visual Data Analysis
@ivda_uzh
Interactive Visual Data Analysis Group @UZH_en. Using a human-centered approach to foster the involvement of humans in the data analysis process.
ID: 1499366706069782529
https://www.ifi.uzh.ch/en/ivda.html 03-03-2022 12:51:15
26 Tweet
43 Followers
40 Following


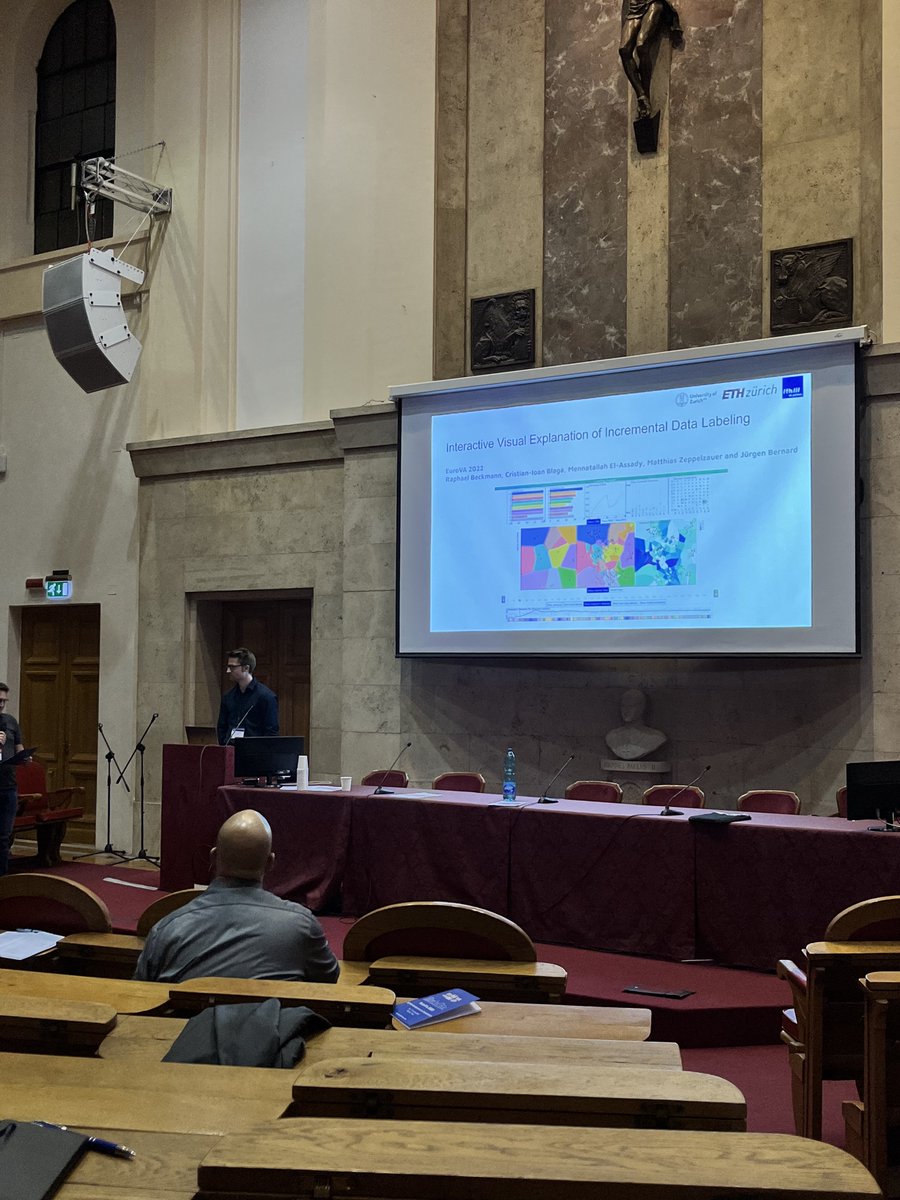
Interactive Visual Data Analysis Thanks to ibrahim al hazwani for jumping in as the Publicity Chair at EuroVA 2022 in Rome! #euro_va #EuroVis2022 EuroVis


We are very excited to welcome Prof. Remco Chang (Tufts University) as a guest in our lab! Remco is an outstanding Visual Analytics researcher, with many impactful technical and methodological publications! #VisualAnalytics #visualization #interactiveML #AcademicTwitter


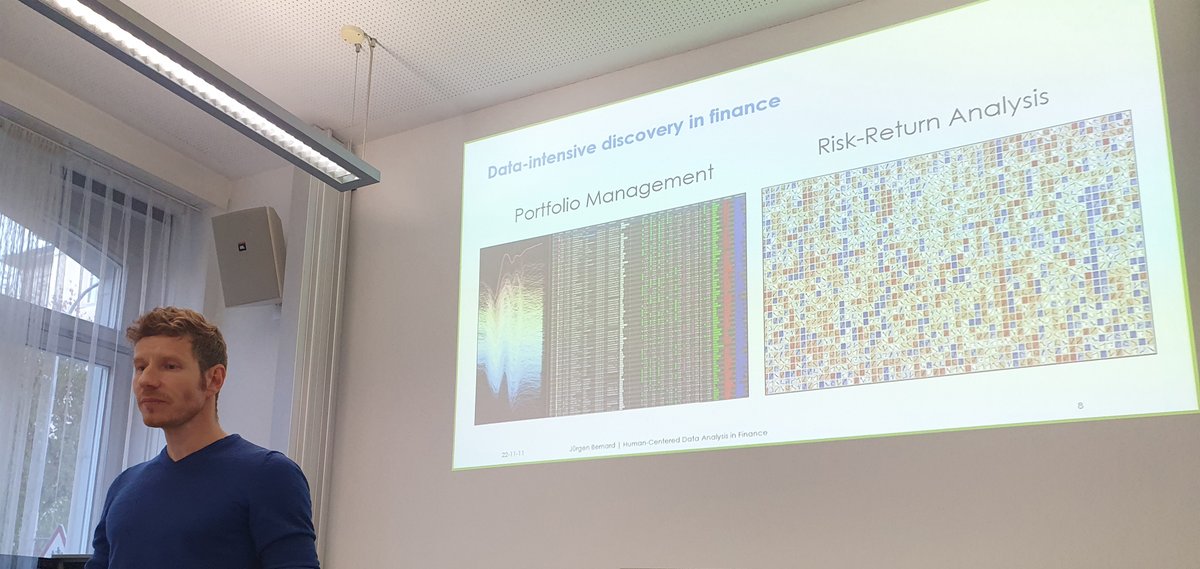
Prof. Jürgen Bernard was invited by Thorsten Hens to talk at the Financial Economics Seminar series at Universität Zürich. His talk was on examples of interactive visual data analysis solutions in the #finance domain with an emphasis on human-centered data analysis. #ivda #HCAI

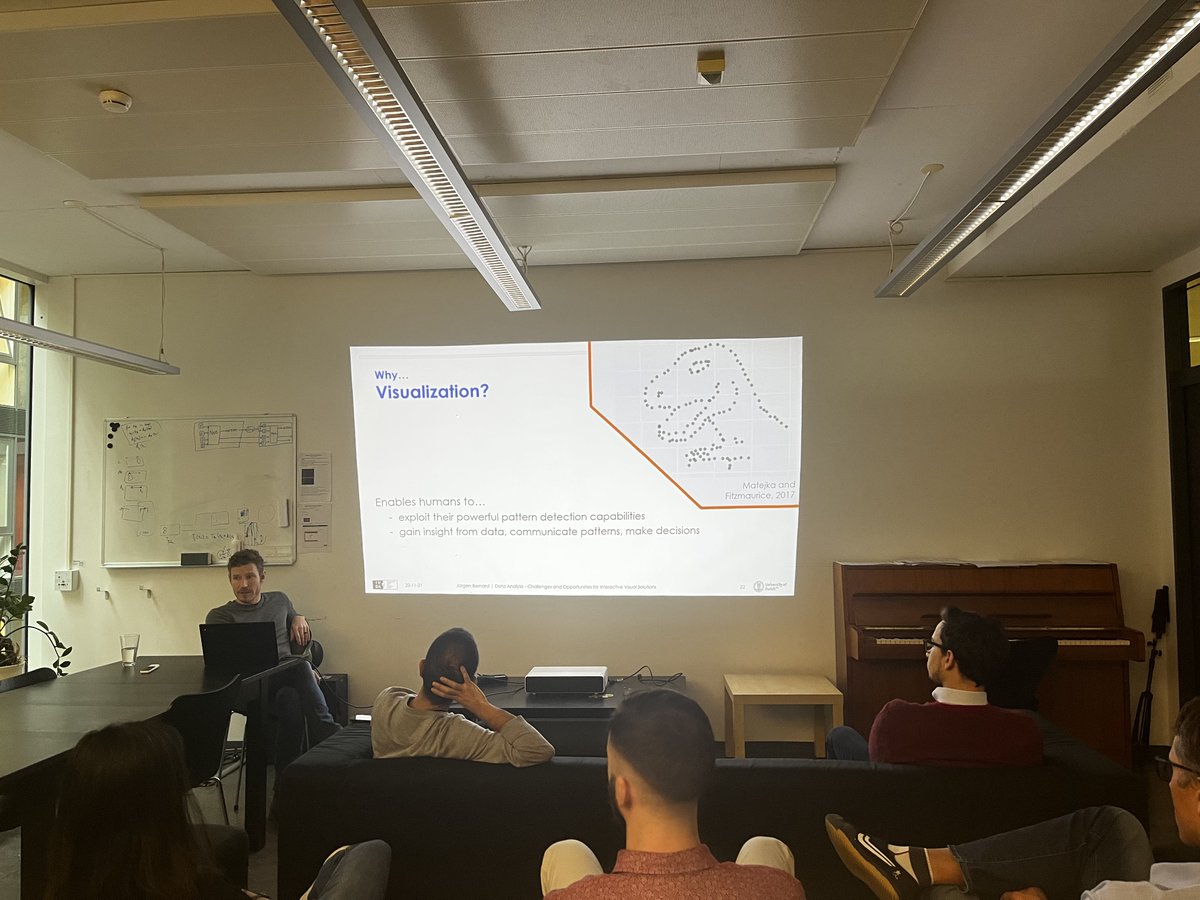
New week, new talk! Prof. Jürgen Bernard was invited by Prof. Davide Scaramuzza to talk about data analysis opportunities for interactive visual solutions, such as the exploration of trajectory patterns and the creation of item rankings #IVDA #visualanalytics #dataviz

Congratulations to ibrahim al hazwani from Jürgen Bernard 's IVDA group, who has successfully run his first workshop about #XAI for recommender system titled "Okay, but why?" #visualanalytics #explainability #recsys #dataviz


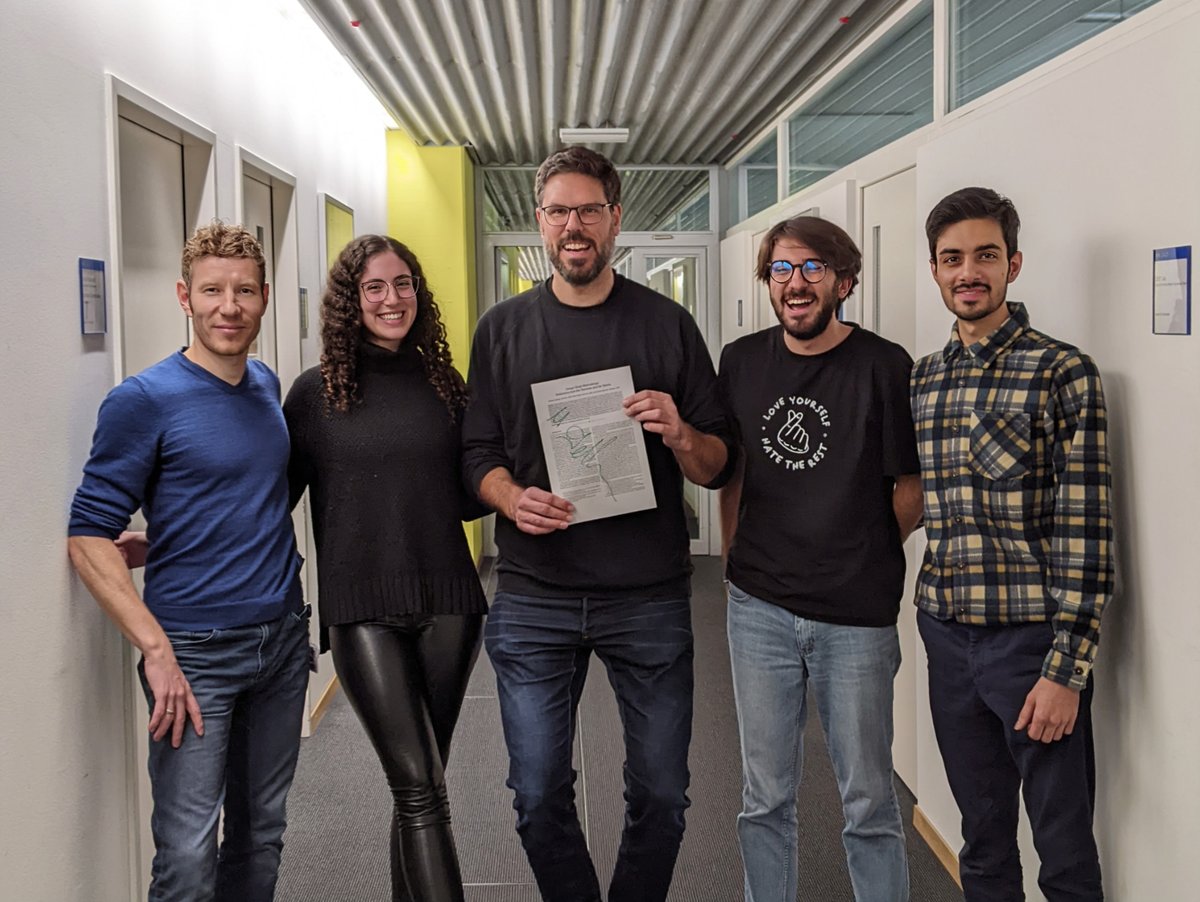
What an eventful first day at EuroVis for the IVDA Lab! Jürgen Bernard for his remarkable contributions as past co-chair at EuroVA, received a certificate of appreciation. Madhav Sachdeva gave a lightning talk at #FairVis, and ibrahim al hazwani presented his work at #EuroVA
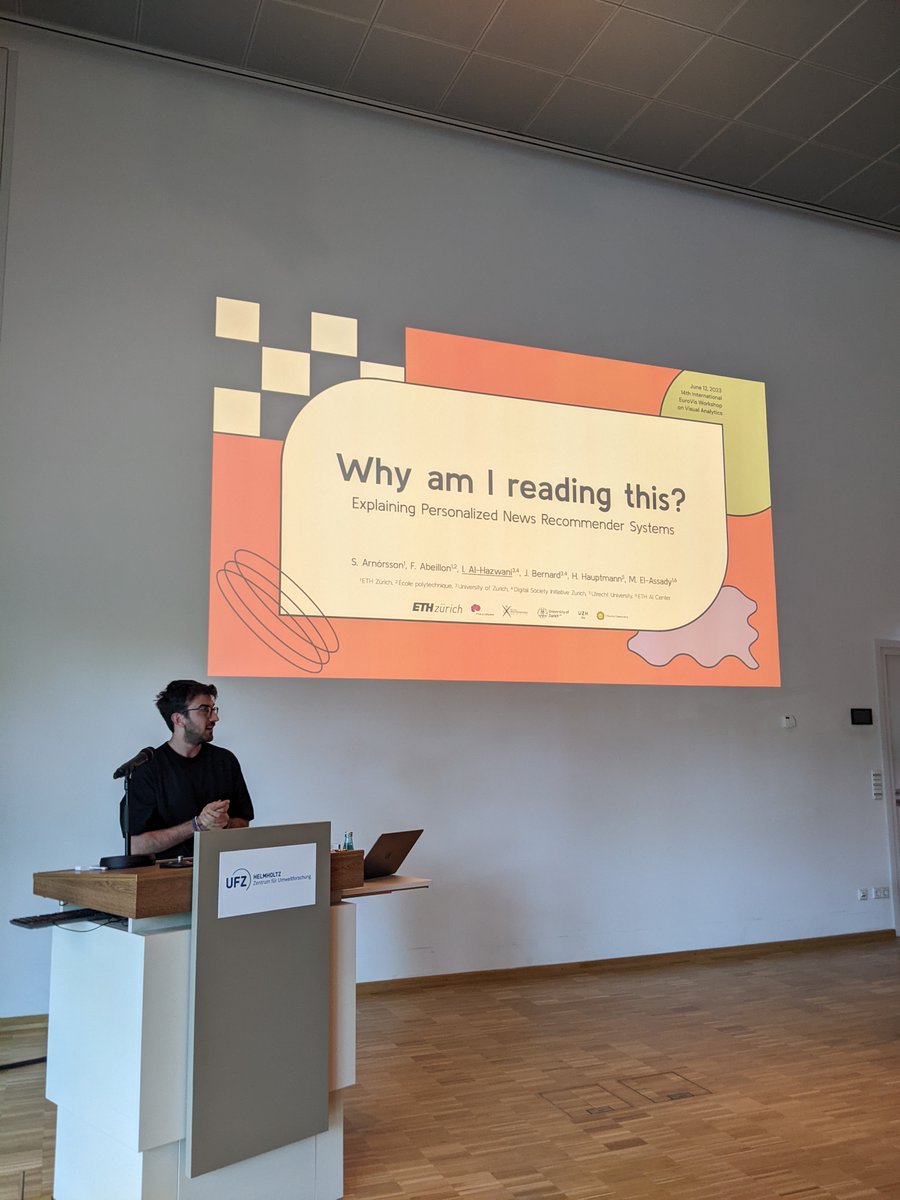

Another great day for the IVDA lab at EuroVis. At the poster session, Madhav Sachdeva presented his work on bridging gaps in digital editions, while ibrahim al hazwani presented his work on interactive explainable recommender systems. Great progress in both areas!


Join us for ORD XPlore, Workshop #2: "Making Digital Editions Interoperable". Tuesday, June 20, 2023, 16h, University of Zurich uzh.ch/de/events/agen… @UZH_dsi Universitätsbibliothek Zürich Interactive Visual Data Analysis

Today is exactly 2 weeks to the #vis2023 Visual Analytics in Healthcare submissions deadline! Academia, healthcare, and industry research all accepted. Show us your most interesting work! Submit here by 17.07.2023: visualanalyticshealthcare.github.io/homepage/2023/… #visualization #VAHC #ieeevis #workshop

Digitale Editionsprojekte an der #Scientifica23 mit dem ZDE, Bullinger Digital, der Johann Caspar Lavater Online Briefedition, ORD XPlore und dem Digitalisierungszentrum der ZB. Vielen Dank allen Beteiligten und den interessierten Besucher*innen! Universitätsbibliothek Zürich Zentralbibliothek Zürich Interactive Visual Data Analysis


