Jess Hepburn (@jesswhomaps) 's Twitter Profile
Jess Hepburn

@jesswhomaps

Research Associate @SPHSU_Places | University of Glasgow | Newcastle based islander. Views are my own.

ID: 1148686446536155137

calendar_today09-07-2019 20:12:45

124 Tweet

361 Followers

467 Following

Places and Health (@sphsu_places) 's Twitter Profile Photo

🚨 REPORT LAUNCH🚨 Places and Children’s Health: A Research and Policy Agenda 👉tinyurl.com/343p7hrd This coproduced report summarises the most pressing research needs identified by stakeholders during a workshop held in May 2023.

🚨 REPORT LAUNCH🚨

Places and Children’s Health: A Research and Policy Agenda 👉tinyurl.com/343p7hrd 

This coproduced report summarises the most pressing research needs identified by stakeholders during a workshop held in May 2023.
Jess Hepburn (@jesswhomaps) 's Twitter Profile Photo

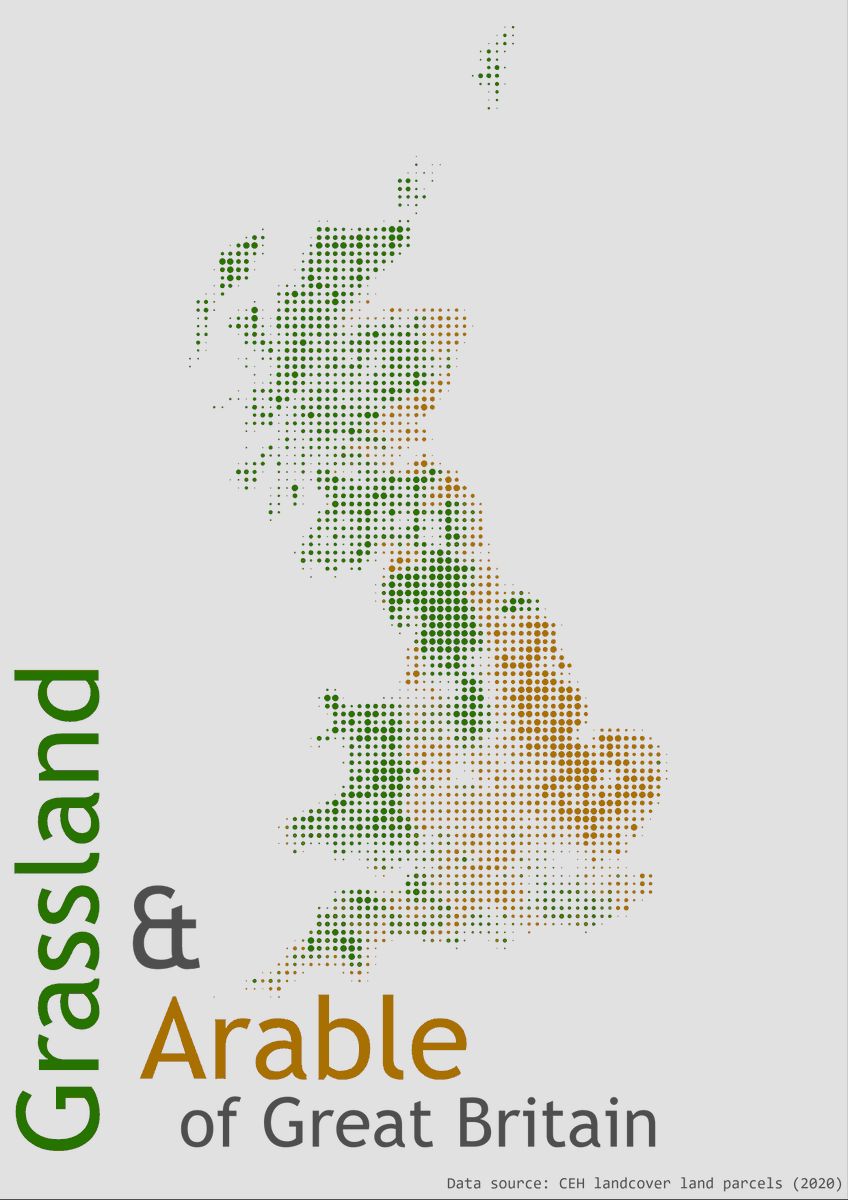
Arable🌾vs Grassland 🌱 Proportional 'points' showing % coverage of Arable and Grassland land cover across Great Britain. Data sourced from UK Centre for Ecology & Hydrology + compiled as part of our current project #BECCA... more to come soon 👀 #30daymapchallenge | Day 1 - Points
Arable🌾vs Grassland 🌱

Proportional 'points' showing % coverage of Arable and Grassland land cover across Great Britain.

Data sourced from <a href="/UK_CEH/">UK Centre for Ecology & Hydrology</a> + compiled as part of our current project #BECCA... more to come soon 👀

#30daymapchallenge | Day 1 - Points
Jess Hepburn (@jesswhomaps) 's Twitter Profile Photo

📍How is London changing? As part of #BECCA, we have quantified change between 2015 to 2020 for the whole of Great Britain using data from Ordnance Survey and UK Centre for Ecology & Hydrology. Here is a fun visual showing the contours of change across London📈 #30daymapchallenge | Day 2 - Lines
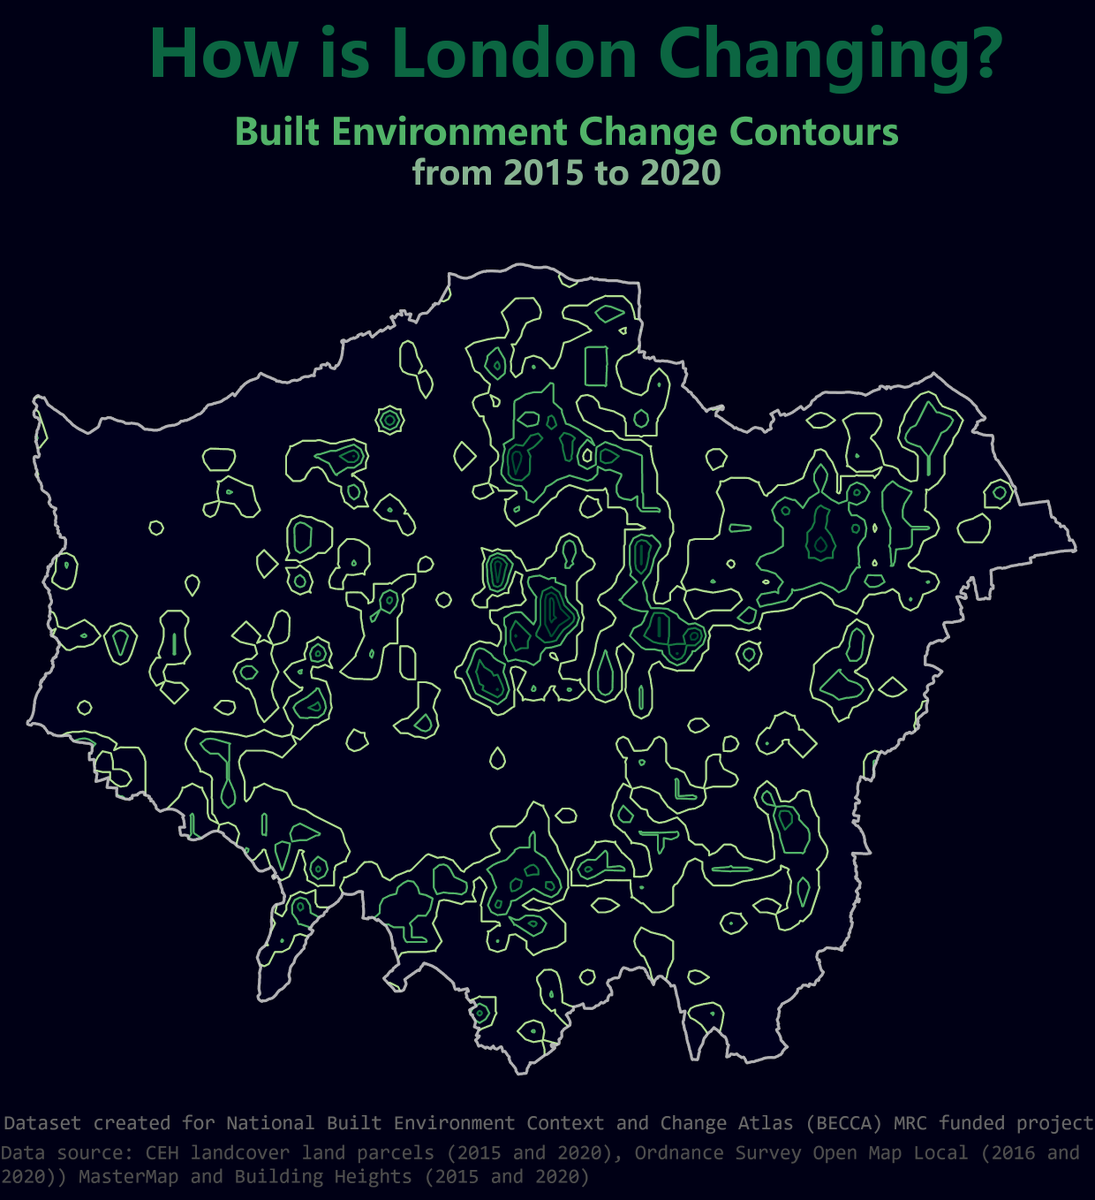
📍How is London changing?

As part of #BECCA, we have quantified change between 2015 to 2020 for the whole of Great Britain using data from <a href="/OrdnanceSurvey/">Ordnance Survey</a> and  <a href="/UK_CEH/">UK Centre for Ecology & Hydrology</a>.

Here is a fun visual showing the contours of change across London📈

#30daymapchallenge | Day 2 - Lines
Jess Hepburn (@jesswhomaps) 's Twitter Profile Photo

I ♥️ my allotment Did you know that only 6% of allotment holders in England are <35 years old? A quick map today to highlight where greenspace is allocated as allotments across Newcastle 🍓🫛🥕 Data - Ordnance Survey Open Greenspace. #30daymapchallenge | Day 3 - polygons
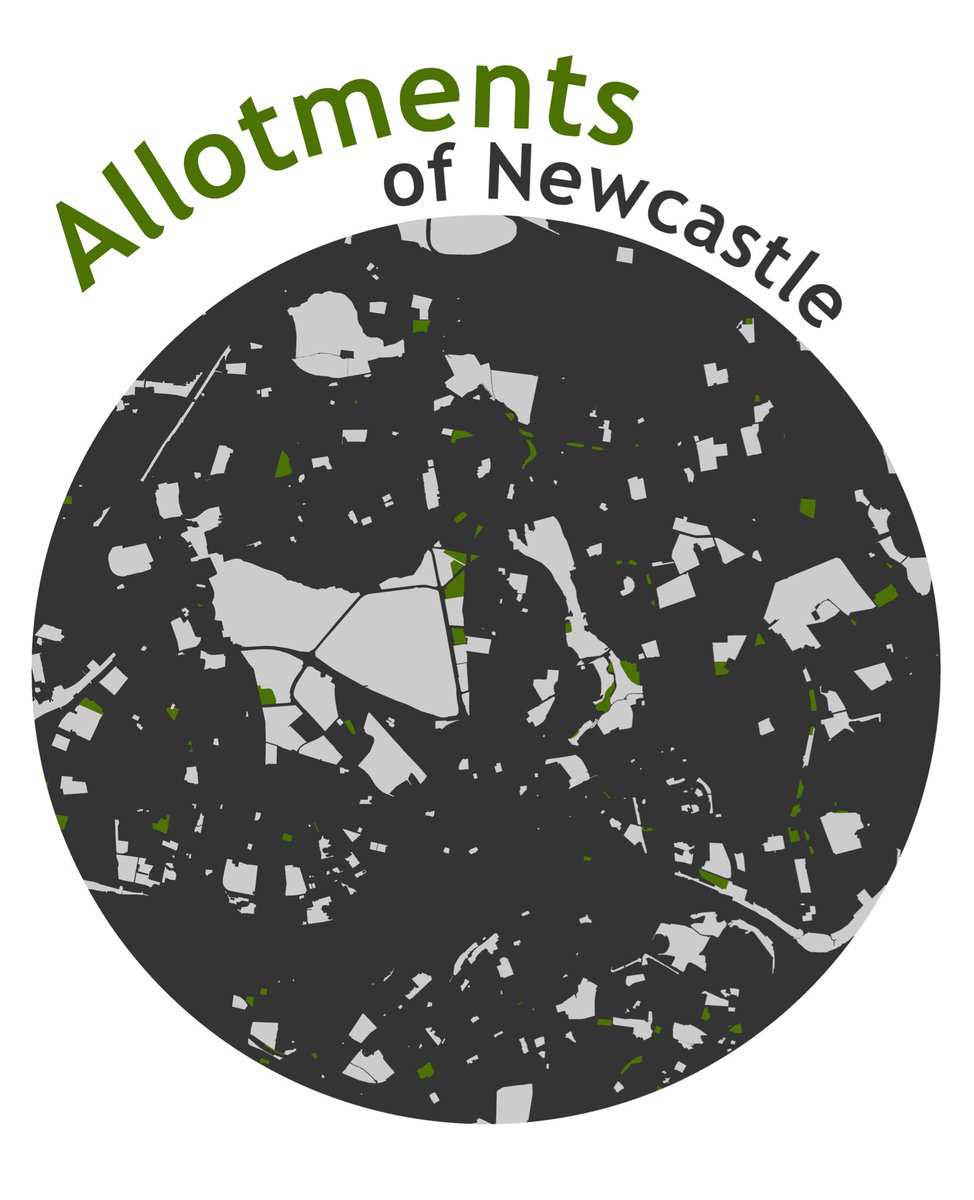
I ♥️ my allotment 

Did you know that only 6% of allotment holders in England are &lt;35 years old? 

A quick map today to highlight where greenspace is allocated as allotments across Newcastle 🍓🫛🥕

Data -  <a href="/OrdnanceSurvey/">Ordnance Survey</a> Open Greenspace. 

#30daymapchallenge | Day 3 - polygons
Places and Health (@sphsu_places) 's Twitter Profile Photo

Places and Health Laura Macdonald, & Historic Environment Scotland Laura Diffey-Higgins, enjoyed being part of the 2023 #ESRCFestival Byres Community Hub. Lots of interest from the public in the well-being benefits of heritage & in our interactive heritage map (created by Jess Hepburn).

<a href="/SPHSU_Places/">Places and Health</a> <a href="/lauramacd78/">Laura Macdonald</a>, &amp; <a href="/HistEnvScot/">Historic Environment Scotland</a> Laura Diffey-Higgins, enjoyed being part of the 2023 #ESRCFestival <a href="/UofGByresHub/">Byres Community Hub</a>. Lots of interest from the public in the well-being benefits of heritage &amp; in our interactive heritage map (created by <a href="/JessWhoMaps/">Jess Hepburn</a>).
Jess Hepburn (@jesswhomaps) 's Twitter Profile Photo

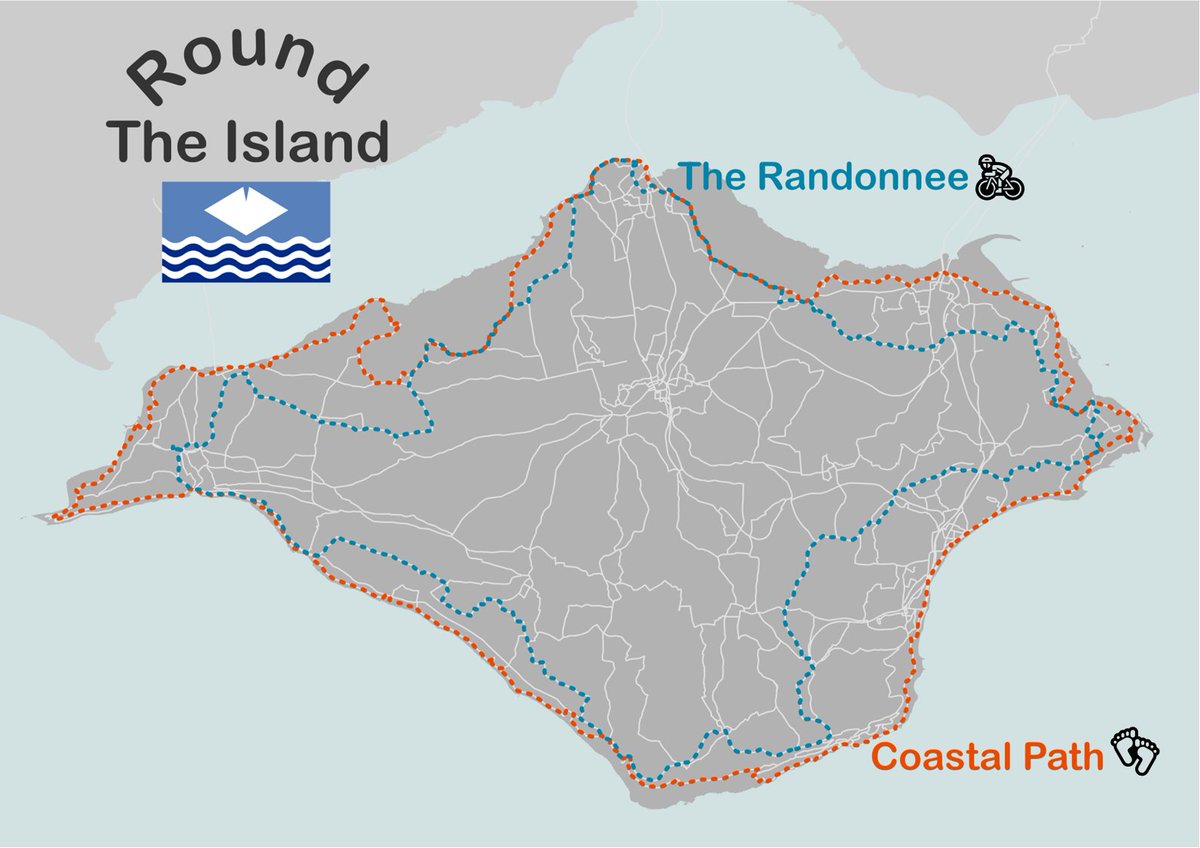
Round the Island 🚶🚴 How to circumnavigate the Isle of Wight by foot and bike - the Randonee cycle is 100km and the coastal path walk is 113km! #30daymapchallenge | Day 7 - Navigation

Round the Island 🚶🚴

How to circumnavigate the Isle of Wight by foot and bike - the Randonee cycle is 100km and the coastal path walk is 113km!

#30daymapchallenge | Day 7 - Navigation
Jess Hepburn (@jesswhomaps) 's Twitter Profile Photo

Percentage of population across North East England born in North America according to Office for National Statistics (ONS) census data. 👶📊 Central Durham and Bensham in Gateshead, have the highest values. #30daymapchallenge | Day 10 - North America
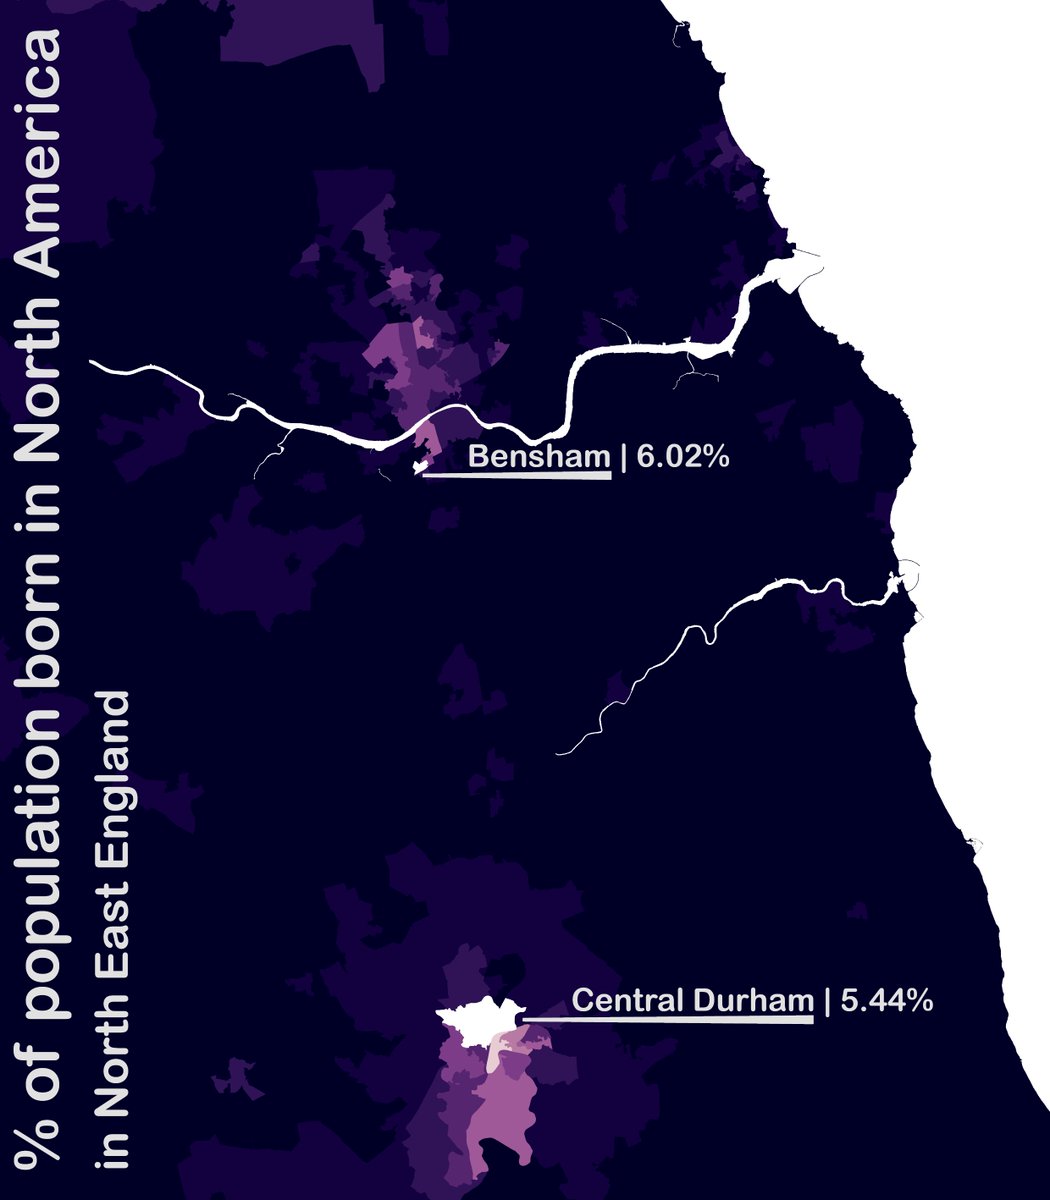
Percentage of population across North East England born in North America according to <a href="/ONS/">Office for National Statistics (ONS)</a> census data. 👶📊

Central Durham and Bensham in Gateshead, have the highest values. 

#30daymapchallenge | Day 10 - North America
Jess Hepburn (@jesswhomaps) 's Twitter Profile Photo

📍How is Great Britain changing? As part of #BECCA, we have created a national dataset that quantifies natural and built environment change across the whole of Great Britain🏢 Interactive map and data available soon... watch this space 👀 #30daymapchallenge | Day 21 - Raster

📍How is Great Britain changing? 

As part of #BECCA, we have created a national dataset that quantifies natural and built environment change across the whole of Great Britain🏢

Interactive map and data available soon... watch this space 👀

#30daymapchallenge | Day 21 - Raster
UBDC (@urbanbigdata) 's Twitter Profile Photo

🌐 Exciting Opportunity! We're seeking a #ResearchAssociate with expert knowledge of #SpatialData science to contribute to an ESRC SDAI-funded project, and lead the production of new research publications and proposals at UBDC. Full details: ow.ly/CrIS50Qacmr #DataJobs

🌐 Exciting Opportunity! We're seeking a #ResearchAssociate with expert knowledge of #SpatialData science to contribute to an ESRC SDAI-funded project, and lead the production of new research publications and proposals at UBDC. Full details: ow.ly/CrIS50Qacmr #DataJobs
Jess Hepburn (@jesswhomaps) 's Twitter Profile Photo

📍 Where are we building? Another map from #BECCA, highlighting where infill and new developments are occurring across South East England🏘️ I really love the binary and simplistic style of this map! #30daymapchallenge | Day 24 - Black & White

📍 Where are we building?  

Another map from #BECCA, highlighting where infill and new developments are occurring across South East England🏘️ 

I really love the binary and simplistic style of this map!  

#30daymapchallenge | Day 24 - Black &amp; White
Jess Hepburn (@jesswhomaps) 's Twitter Profile Photo

Glad to see our paper from last year included in this special issue! Eye-tracking in map use, map user and map usability research: what are we looking for? Read more here -> tandfonline.com/doi/full/10.10…

British Geological Survey (@britgeosurvey) 's Twitter Profile Photo

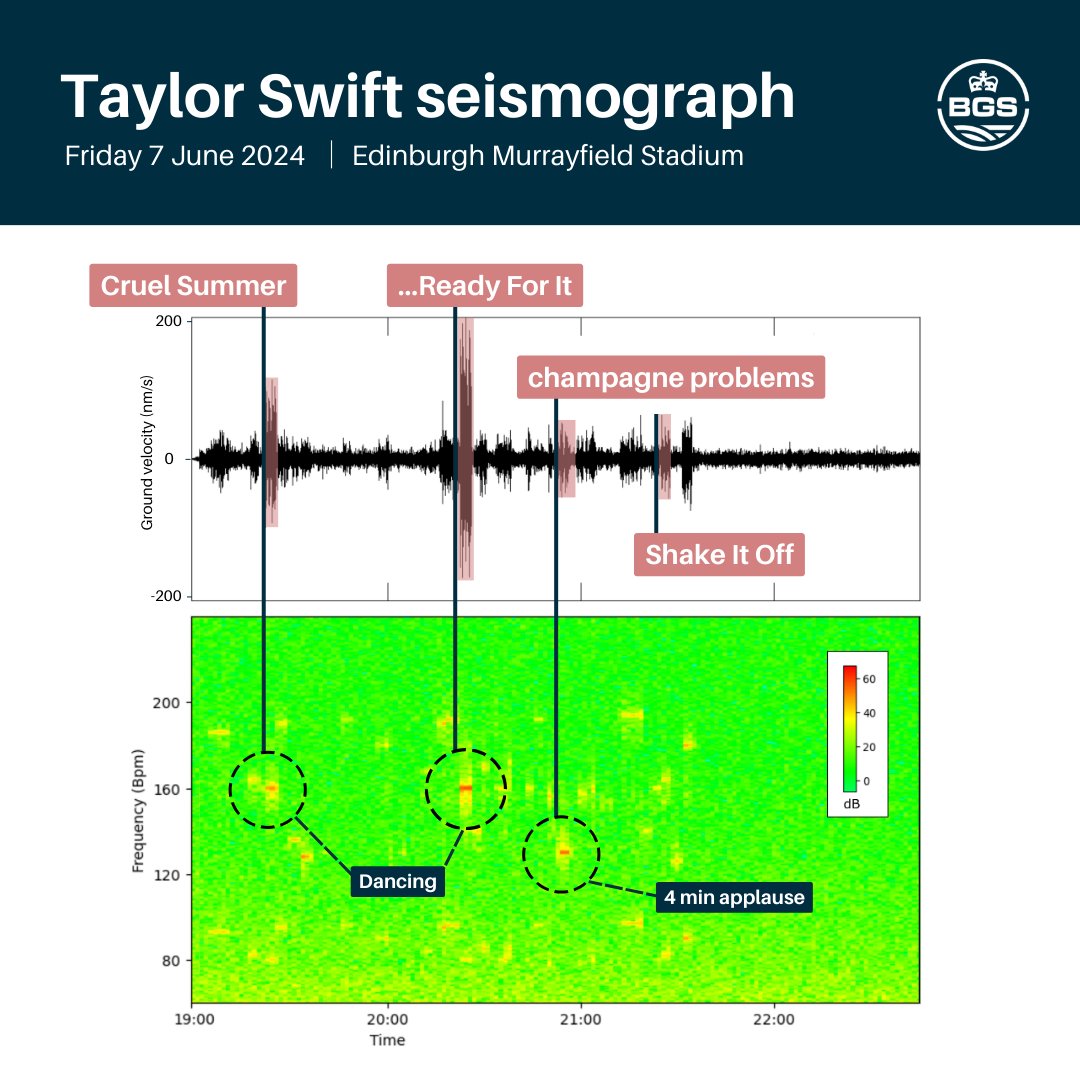
Quake it off! Seismometers around Edinburgh were triggered by the rapturous Taylor Swift crowds at Murrayfield Stadium over the weekend. bgs.ac.uk/news/quake-it-…

Quake it off! Seismometers around Edinburgh were triggered by the rapturous Taylor Swift crowds at Murrayfield Stadium over the weekend.

bgs.ac.uk/news/quake-it-…
Improving Health (@thesphsu) 's Twitter Profile Photo

Spending time in nature boosts children's mental health - especially for those from low-income families 🌳🌻 New paper by Places and Health gla.ac.uk/news/headline_… #nature #mentalhealth #greenspace #equigenesis

Spending time in nature boosts children's mental health - especially for those from low-income families 🌳🌻

New paper by <a href="/SPHSU_Places/">Places and Health</a> gla.ac.uk/news/headline_…

#nature #mentalhealth #greenspace #equigenesis
Jess Hepburn (@jesswhomaps) 's Twitter Profile Photo

I recently presented our research on classifying every park in Great Britain at the Esri UK Scottish Conference! We uncovered distinct park types across the country by objectively measuring park qualities. Watch here 👇 youtube.com/watch?v=p3Woka… Questions? DM me! 💡