Mathew Lipson (@matlipson) 's Twitter Profile
Mathew Lipson

@matlipson

Urban researcher/modeller. Focussed on developing better urban climate models. isithotrightnow.com | theurbanist.com.au

ID: 824718064818139136

calendar_today26-01-2017 20:38:03

569 Tweet

740 Followers

532 Following

Urban Analytics Lab (@urbanalyticslab) 's Twitter Profile Photo

Scientific Data publishes a collaborative paper (led by Nikola Milojević-Dupont & Felix Wagner) that, with 200+ million individual buildings, presents one of the most comprehensive efforts on building information globally. Read more: ual.sg/post/2023/03/2… (1/5)

Matthias Demuzere (@mdemuzere) 's Twitter Profile Photo

Over the past few years, Mathew Lipson has been coordinating the massive URBAN-PLUMBER / #urban #model intercomparison. Phase I results are now being presented at #ICUC11Sydney 11th International Conference on Urban Climate International Association for Urban Climate Also an outcome: harmonised flux tower dataset: essd.copernicus.org/articles/14/51…
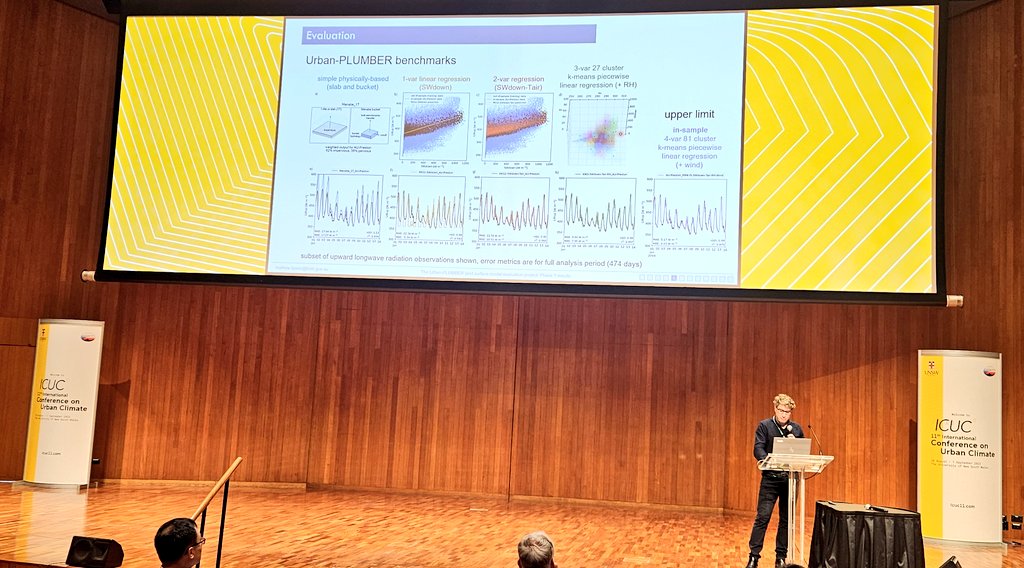
Over the past few years, <a href="/MatLipson/">Mathew Lipson</a> has been coordinating the massive URBAN-PLUMBER / #urban #model intercomparison. Phase I results are now being presented at #ICUC11Sydney <a href="/ICUC11Sydney/">11th International Conference on Urban Climate</a> <a href="/IAUrbanClimate/">International Association for Urban Climate</a> 

Also an outcome: harmonised flux tower dataset: essd.copernicus.org/articles/14/51…
Melissa Hart (@melissatraveler) 's Twitter Profile Photo

#ICUC11Sydney people, wondering if this super warm day is normal for Sydney in August? Check out “is it hot right now” to compare today to climatological average conditions isithotrightnow.com/sydney-city/ #BloodyHot #Winter

#ICUC11Sydney people, wondering if this super warm day is normal for Sydney in August? 

Check out “is it hot right now” to compare today to climatological average conditions

isithotrightnow.com/sydney-city/

#BloodyHot #Winter
Mathew Lipson (@matlipson) 's Twitter Profile Photo

Exploring electricity demand vs temperature at suburb level over 24hrs: on the left a classic "V" response in a suburb with large residential %, little weekend difference. On right large industrial %, no V, large weekend difference. In middle, large commercial %, mixed response.

UNSW Climate Change Research Centre (@ccrc_unsw) 's Twitter Profile Photo

PhD Student Marzie Naserikia and coauthors recently published a paper in Science of the Total Environment on the role of urban form and seasonality in land surface and air temperature dynamics. Check out the graphical abstract, plus the thread for key findings and links. Congrats to all involved!
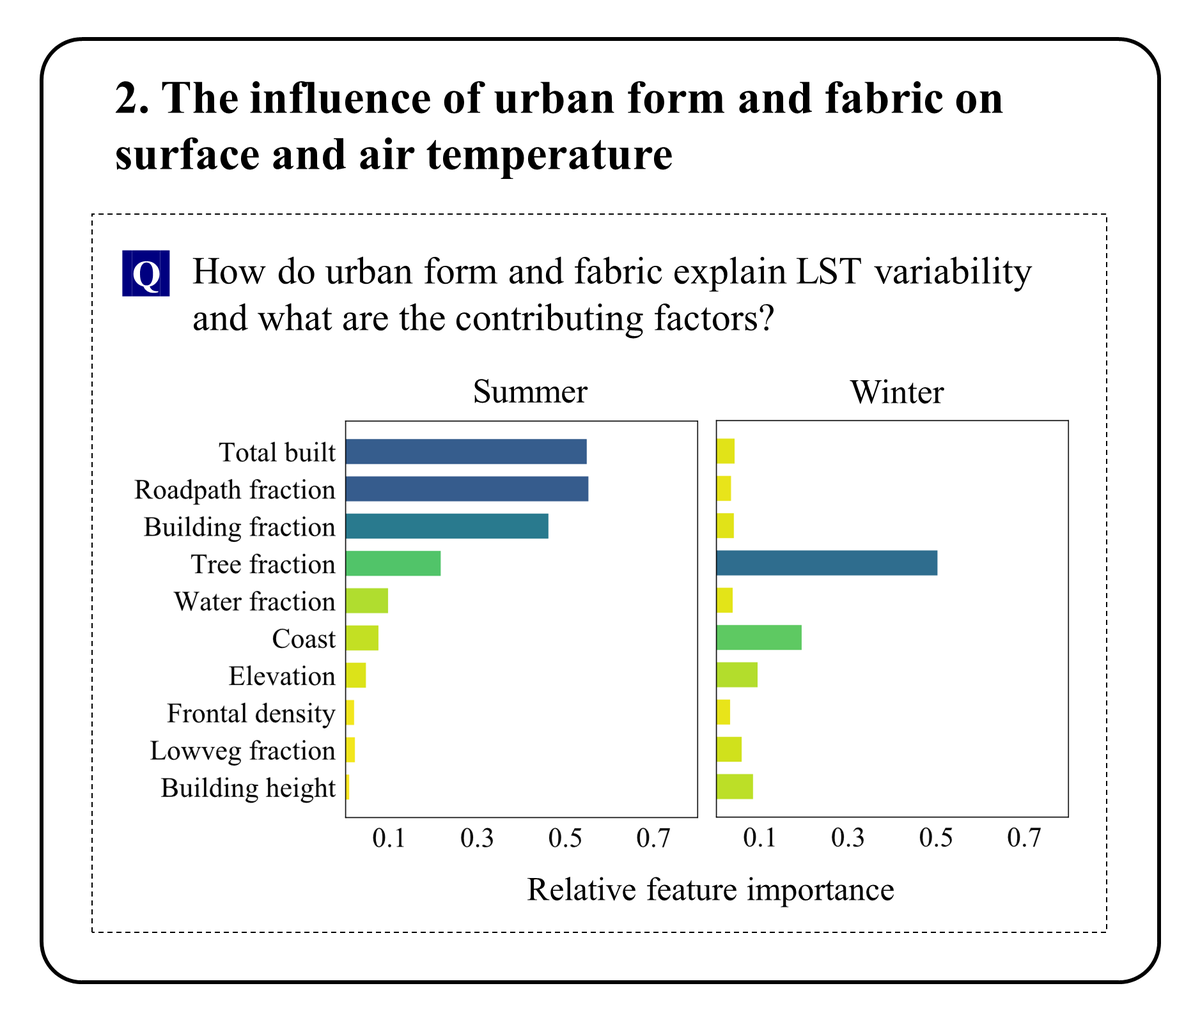
PhD Student Marzie Naserikia and coauthors recently published a paper in <a href="/SciTotEnv/">Science of the Total Environment</a> on the role of urban form and seasonality in land surface and air temperature dynamics.

Check out the graphical abstract, plus the thread for key findings and links. 

Congrats to all involved!
Lewis Blunn (@lewis_blunn) 's Twitter Profile Photo

New machine learning paper on the use of crowdsourced observations and high-resolution land cover to downscale and bias correct kilometre-scale operational air temperature forecasts to hectometre scale in urban areas. doi.org/10.1002/met.22…