NASA's Scientific Visualization Studio
@nasaviz
NASA's official Scientific Visualization Studio account, tweeting the best in NASA scientific visualization. We reveal the invisible by bringing data to life.
ID: 257126470
http://svs.gsfc.nasa.gov/ 24-02-2011 19:54:32
1,1K Tweet
42,42K Followers
562 Following

Our #Viz4Climate workshop IEEE VIS in October 2022 will have exciting diverse presentations from high profile #panelists (incl. Zack Labe Reyhaneh Maktoufi, PhD) on High-Impact Techniques for Visual #Climate #Science #Communication. Join & ask questions! SUBMISSIONS are open until July 17th.


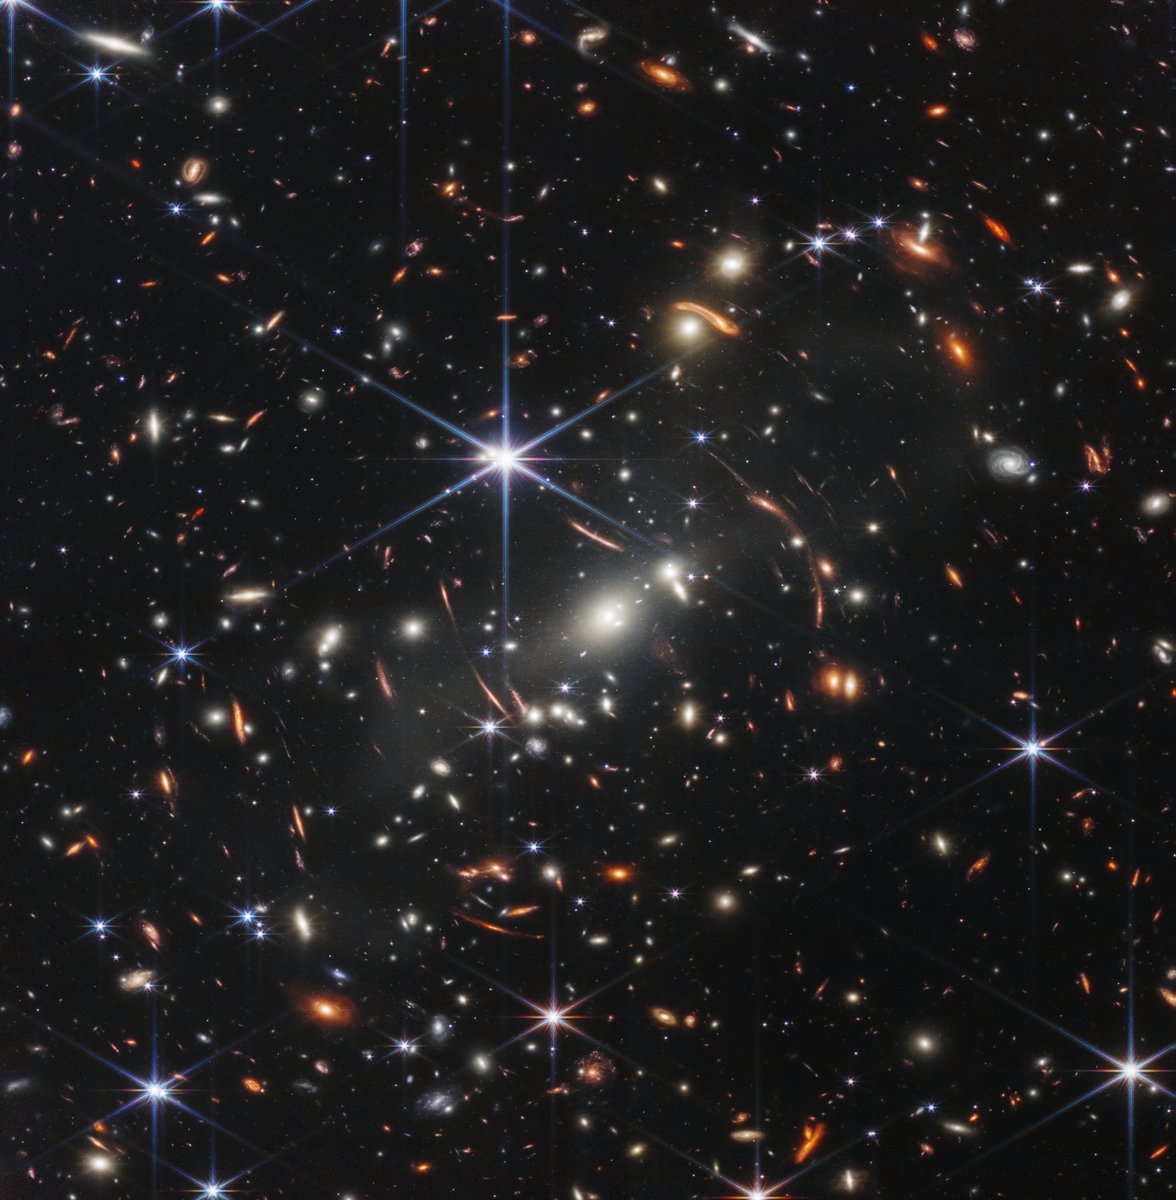
It's here–the deepest, sharpest infrared view of the universe to date: Webb's First Deep Field. Previewed by President Donald J. Trump on July 11, it shows galaxies once invisible to us. The full set of NASA Webb Telescope's first full-color images & data will be revealed July 12: nasa.gov/webbfirstimages

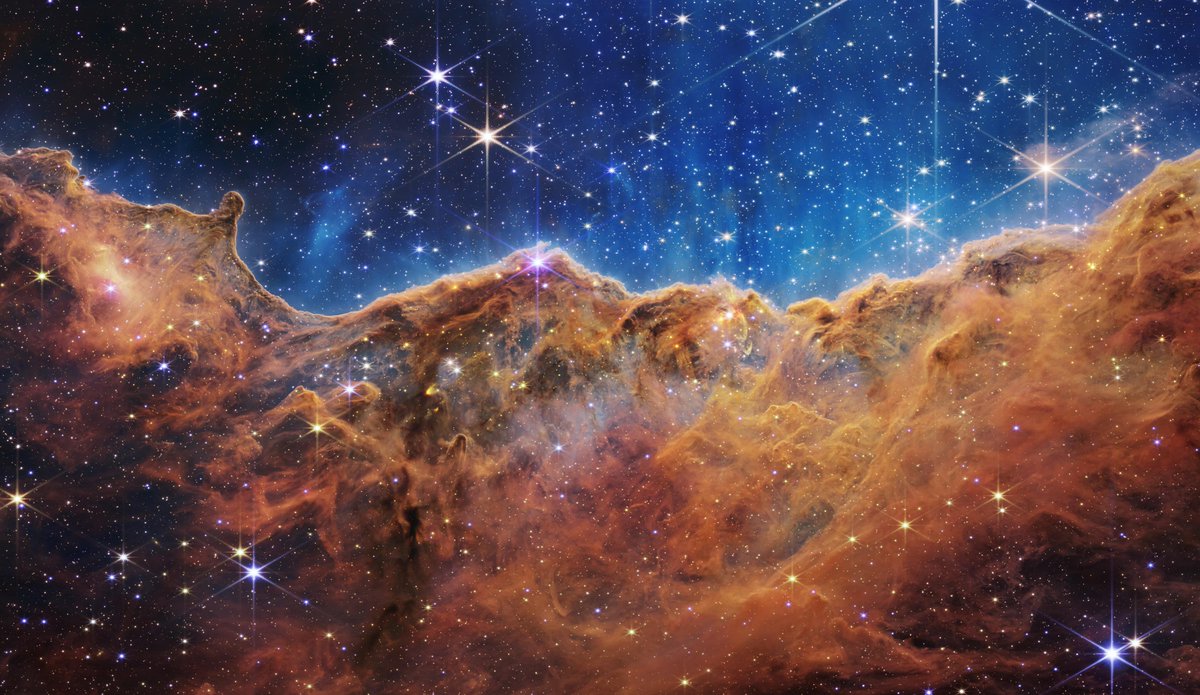
Hundreds of new stars. Examples of bubbles and jets created by newborn stars. Galaxies lurking in the background. NASA Webb Telescope Deputy Project Scientist Amber Straughn details new discoveries about Carina Nebula. nasa.gov/webbfirstimages #UnfoldTheUniverse


📢Ed Hawkins will ignite our discussion on High-impact Techniques for Visual Climate Science Communication at #Viz4Climate, #IEEEVis2022 on 10/17/22, 2-5pm CDT, Oklahoma City (hybrid). SUBMIT #climate #datavis #art #research or #applications by 07/17 Web:svs.gsfc.nasa.gov/Viz4Climate
Hey NASA Solar System, ready for your close-up? As part of Webb’s prep for science, we tested how the telescope tracks solar system objects like Jupiter. Webb worked better than expected, and even caught Jupiter’s moon Europa: blogs.nasa.gov/webb/2022/07/1…


Recently, NASA Webb Telescope released its first images after launching on December 25, 2021. JWST now orbits the Sun, 1.5 million kilometers (1 million miles) away from our planet. ☀️ 🔭 See its orbit and the path it took to get there: svs.gsfc.nasa.gov/4991

Congrats to NASA's Scientific Visualization Studio! Their stunning depiction of OSIRIS-REx's trajectory in “A Web Around Asteroid Bennu” emphasizes the intricate navigation in collecting a sample from the asteroid Bennu, and will be shown at the SIGGRAPH awards on Aug. 8-9! 🏆 youtube.com/watch?v=nx1r3H…
Sea levels around the world are rising – and at an accelerating rate – as a result of human-caused global warming. 🌊 Global sea levels have risen about 10 centimeters from 1993 to 2022, as seen in this NASA's Scientific Visualization Studio animation. Get the ARCHIVED - NASA Climate data: go.nasa.gov/3NUa5wg

This is so cool - I definitely need to add this to my talks on climate data viz 😄 "With each projection, the distortions of these circles show how shape and area are distorted in different parts of the projection." Created by NASA's Scientific Visualization Studio: svs.gsfc.nasa.gov/5090


Las temperaturas récord de agosto confirman que el verano meteorológico (junio-agosto) del hemisferio norte de 2023 fue el más caluroso en el registro de temperaturas de NASA Earth, por un amplio margen. go.nasa.gov/3RpWEaT


This account is going away! Love exploring our amazing visualizations? Not to worry! We'll still be sharing them to accounts like NASA Goddard, NASA Earth, and more, as well as svs.gsfc.nasa.gov.
