Tenzer Lab (@tenzerlab) 's Twitter Profile
Tenzer Lab

@tenzerlab

Focusing on quantitative proteomics using ion mobility and data-independent acquisition techniques

ID: 1204407014685904896

calendar_today10-12-2019 14:26:39

177 Tweet

629 Followers

334 Following

Tenzer Lab (@tenzerlab) 's Twitter Profile Photo

Want to learn how to optimize your #DDA-PASEF acquisition for #immunopeptidomics? Use Thunder-DDA-PASEF! See our paper by DavidGZ from HI-TRON Mainz: rdcu.be/dA7di Thanks to a wonderful collaboration with CompOmics and Christine CARAPITO!

Tenzer Lab (@tenzerlab) 's Twitter Profile Photo

Job Alert 🌟 We are recruiting a postdoc in #lcms based #immunopeptidomics in our group HI-TRON Mainz - position is fully funded for two years. Check the job description and apply here: jobs.dkfz.de/en/jobs/166492… Please RT!

DKFZ (@dkfz) 's Twitter Profile Photo

Apply now for the Summer Selection of the International #PhD Program at the German Cancer Research Center, covering all areas of #cancerresearch, including #datascience, #bioinformatics, #epidemiology, #medicalphysics. To apply for your #PhDatDKFZ visit ➡️ t1p.de/3f58d

Apply now for the Summer Selection of the International #PhD Program at the German Cancer Research Center, covering all areas of #cancerresearch, including #datascience, #bioinformatics, #epidemiology, #medicalphysics. To apply for your #PhDatDKFZ visit ➡️ t1p.de/3f58d
DKFZ Immunology Infection and Cancer (@dkfzimmunology) 's Twitter Profile Photo

Follow this excellent tutorial if you want to improve your DDA-PASEF acquisitions with Thunder-DDA-PASEF and ensure high-coverage immunopeptidomics analyses ⬇️ Huge congrats to Tenzer Lab DavidGZ and co-authors for this fantastic work recently published in Nature Communications! 👏

Mushtaq Bilal, PhD (@mushtaqbilalphd) 's Twitter Profile Photo

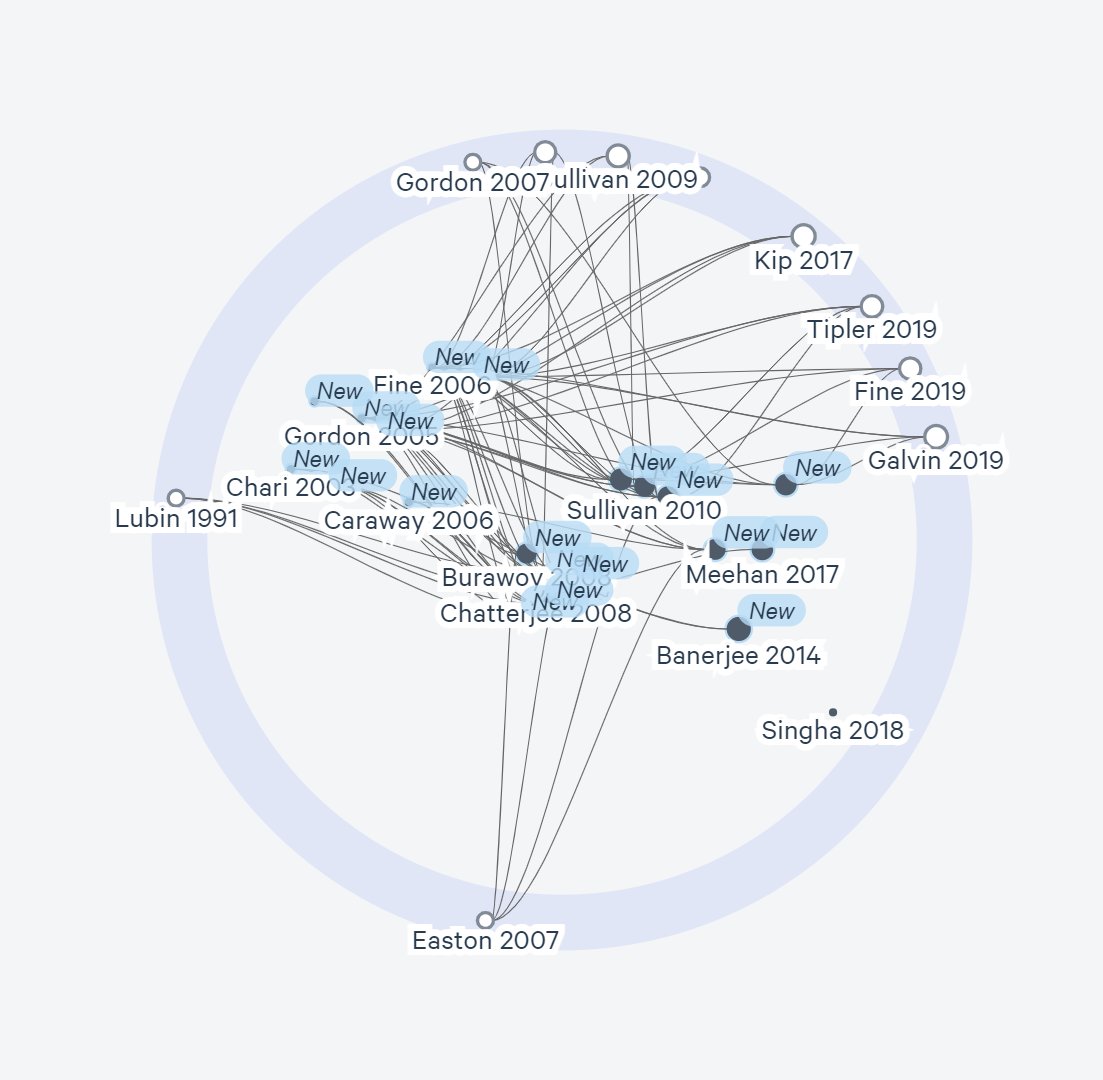
☹️Google Scholar is a great tool. But it doesn't show how papers are connected with each other. 😀Here's how to fast-track your literature review with a "visual search." And export your papers to Zotero, Mendeley, or EndNote. You can learn this workflow in 15 min:

☹️Google Scholar is a great tool. But it doesn't show how papers are connected with each other.

😀Here's how to fast-track your literature review with a "visual search."

And export your papers to Zotero, Mendeley, or EndNote.

You can learn this workflow in 15 min:
Human Protein Atlas (@proteinatlas) 's Twitter Profile Photo

A new version 24 of the Human Protein Atlas resource has been released at the HUPO meeting in Dresden, Germany. The data is summarized in eight resources covering different aspects of human protein-coding genes in tissues, cells, cell lines and blood. proteinatlas.org/news/2024-10-2…

A new version 24 of the Human Protein Atlas resource has been released at the HUPO meeting in Dresden, Germany. The data is summarized in eight resources covering different aspects of human protein-coding genes in tissues, cells, cell lines and blood. 

proteinatlas.org/news/2024-10-2…
Julian Beyrle (@julianbeyrle) 's Twitter Profile Photo

Thrilled to have shared our latest research on "MAETi: Mild Acid Elution in a Tip enables MS-based immunopeptidomics profiling from as low as 50,000 cells" at #HUPO2024 in Dresden! (1/3)

Thrilled to have shared our latest research on "MAETi: Mild Acid Elution in a Tip enables MS-based immunopeptidomics profiling from as low as 50,000 cells" at #HUPO2024 in Dresden!  (1/3)
Julian Beyrle (@julianbeyrle) 's Twitter Profile Photo

The event was an incredible learning experience in #proteomics while reconnecting with old friends and making new ones in the community. Special thanks to #DGPF and @HUPO_org for supporting my journey with a travel grant. (2/3)

Julian Beyrle (@julianbeyrle) 's Twitter Profile Photo

Big shoutout to Tenzer Lab, DavidGZ, and my fantastic colleagues for their support. Learn more about MAETi and stay tuned for the upcoming preprint! (3/3) #TeamMassSpec #immunopeptidomics

Prof. Dr. Friedrich Longin (@friedrichlongin) 's Twitter Profile Photo

3 PostDocs and 2 PhD students drive the project #BETTERWHEAT. Besides large coordination efforts, tasks encompass phenotypic analyses of field data, genome-wide association mapping, proteome profiling and the use of machine learning for prediction of baking quality

3 PostDocs and 2 PhD students drive the project #BETTERWHEAT. Besides large coordination efforts, tasks encompass phenotypic analyses of field data, genome-wide association mapping, proteome profiling and the use of machine learning for prediction of baking quality
Prof. Dr. Friedrich Longin (@friedrichlongin) 's Twitter Profile Photo

#Betterwheat results 1: 282 wheat cultivars originated from D and surrounding countries from different decades of breeding. They differed in agronomic and quality traits; e.g. yield ranged from 7.3-10.7 t/ha, bread loaf volume between 472-782ml & flour yield between 35-60%

#Betterwheat results 1: 282 wheat cultivars originated from D and surrounding countries from different decades of breeding. They differed in agronomic and quality traits; e.g. yield ranged from 7.3-10.7 t/ha, bread loaf volume between 472-782ml & flour yield between 35-60%
Prof. Dr. Friedrich Longin (@friedrichlongin) 's Twitter Profile Photo

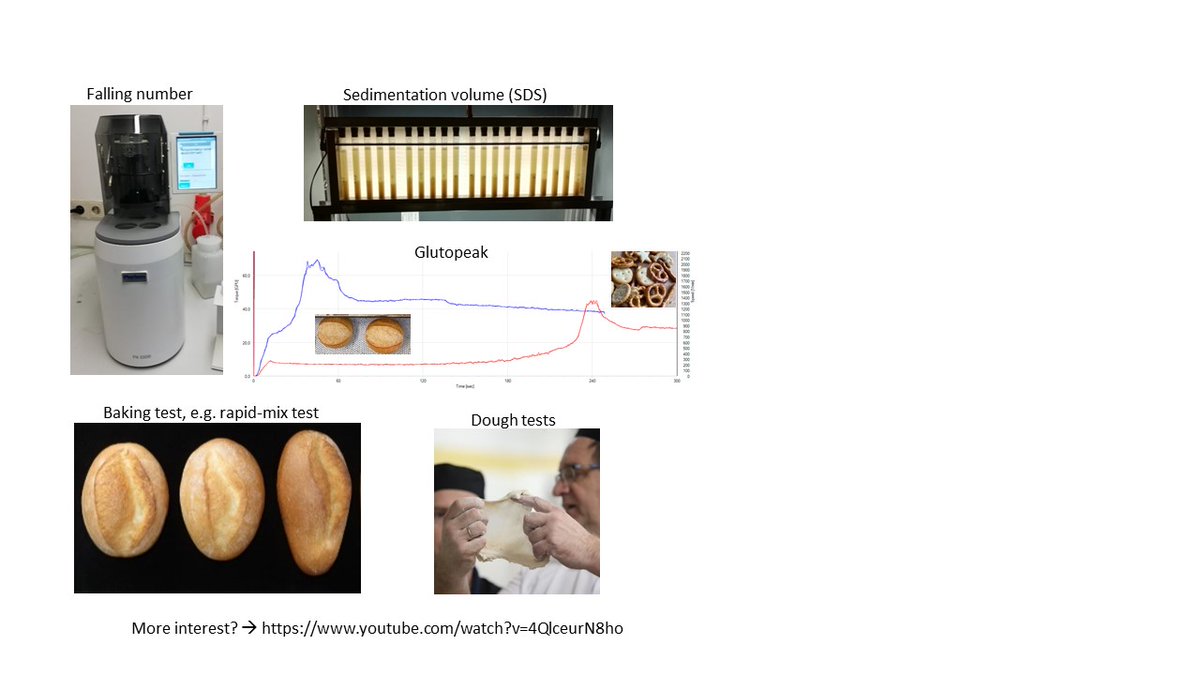
#Betterwheat results 2: Loaf volume from rapid-mix-test correlated most strongly (r = 0.7) with protein content and Extensograph, followed by SDS, Glutograph and Glutopeak. Methods describing starch quality (falling, RVA, amylase activity) did not correlate with loaf volume.

#Betterwheat results 2: Loaf volume from rapid-mix-test correlated most strongly (r = 0.7) with protein content and Extensograph, followed by SDS, Glutograph and Glutopeak. Methods describing starch quality (falling, RVA, amylase activity) did not correlate with loaf volume.
Prof. Dr. Friedrich Longin (@friedrichlongin) 's Twitter Profile Photo

#Betterwheat results 3: Three different spectrometers were used to predict quality parameters of wheat cultivars. Correlations between predicted and measured values were surprisingly high (r > 0.8) for many quality traits like loaf volume, SDS and water uptake of dough.

#Betterwheat results 3: Three different spectrometers were used to predict quality parameters of wheat cultivars. Correlations between predicted and measured values were surprisingly high (r > 0.8) for many quality traits like loaf volume, SDS and water uptake of dough.
Prof. Dr. Friedrich Longin (@friedrichlongin) 's Twitter Profile Photo

#Betterwheat results 4: Starch properties measured by RVA correlated tightly with falling number (r>0.8), while correlation between α-amylase activity and falling number was lower (r = -0.68). Joint major QTLs influencing at least two of these traits were found

#Betterwheat results 4: Starch properties measured by RVA correlated tightly with falling number (r>0.8), while correlation between α-amylase activity and falling number was lower (r = -0.68). Joint major QTLs influencing at least two of these traits were found
Prof. Dr. Friedrich Longin (@friedrichlongin) 's Twitter Profile Photo

#Betterwheat results 5: Testing cultivars registered during different decades of breeding, we show that breeding has improved disease resistance & grain yield, and bread loaf volume was maintained due to improved SDS although a reduction in protein content was visible

#Betterwheat results 5: Testing cultivars registered during different decades of breeding, we show that breeding has improved disease resistance & grain yield, and bread loaf volume was maintained due to improved SDS although a reduction in protein content was visible
Prof. Dr. Friedrich Longin (@friedrichlongin) 's Twitter Profile Photo

#Betterwheat results 6: Mineral content (Fe, Zn, P, S) of wheat cultivars was positively correlated with their protein content (r > 0.6), but negatively with yield (r < -0.5). Selection for baking quality needs compromise for yield but could be combined with mineral content.

#Betterwheat results 6: Mineral content (Fe, Zn, P, S) of wheat cultivars was positively correlated with their protein content (r &gt; 0.6), but negatively with yield (r &lt; -0.5). Selection for baking quality needs compromise for yield but could be combined with mineral content.
Prof. Dr. Friedrich Longin (@friedrichlongin) 's Twitter Profile Photo

#Betterwheat results 7: One joint genomic region (major QTL) was found influencing protein & mineral content but 2 of 4 major QTLs found for Zn and yield were in close genomic vicinity with opposite trait effects explaining partly the negative correlation of yield and Zn content

#Betterwheat results 7: One joint genomic region (major QTL) was found influencing protein &amp; mineral content but 2 of 4 major QTLs found for Zn and yield were in close genomic vicinity with opposite trait effects explaining partly the negative correlation of yield and Zn content
Prof. Dr. Friedrich Longin (@friedrichlongin) 's Twitter Profile Photo

#Betterwheat results 8: High-throughput LC-MS proteomics was established @tenzerlab delivering >6.000 proteins for 1.200 samples (282 wheat cultivars grown at 4 locations) representing the first “pan-proteome” of wheat grain. ~100 proteins had high correlations to quality traits

#Betterwheat results 8: High-throughput LC-MS proteomics was established @tenzerlab delivering &gt;6.000 proteins for 1.200 samples (282 wheat cultivars grown at 4 locations) representing the first “pan-proteome” of wheat grain. ~100 proteins had high correlations to quality traits
Prof. Dr. Friedrich Longin (@friedrichlongin) 's Twitter Profile Photo

#Betterwheat results 9: Protein content & grain yield were strongly correlated, which was partly influenced by genes located in similar genomic regions. Similarly, 11 proteins influenced grain yield and protein content with 5 of them having QTLs within above genomic regions

#Betterwheat results 9: Protein content &amp; grain yield were strongly correlated, which was partly influenced by genes located in similar genomic regions. Similarly, 11 proteins influenced grain yield and protein content with 5 of them having QTLs within above genomic regions