Paul Maidowski (@_ppmv) 's Twitter Profile
Paul Maidowski

@_ppmv

archived account - DMs open. Resilience, climate mitigation, bamboo, Covid policy. Fletcher School/Fulbright. d|e|f|i|中. @ppmv.bsky.social

ID: 223264842

calendar_today05-12-2010 22:02:13

50,50K Tweet

9,9K Followers

2,2K Following

Isabella M Weber (@isabellamweber) 's Twitter Profile Photo

The global distribution of wealth is enormously consequential. Yet, how the mega trend of our time, climate change, impacts this distribution remains vastly understudied. Lucas Chancel, GregorSemieniuk.bsky.social & co finally raise this crucial question in their latest article.

The global distribution of wealth is enormously consequential. Yet, how  the mega trend of our time, climate change, impacts this distribution  remains vastly understudied.

<a href="/lucas_chancel/">Lucas Chancel</a>, <a href="/GregorSemieniuk/">GregorSemieniuk.bsky.social</a> &amp; co finally raise this crucial question in their latest article.
Keeling_Curve (@keeling_curve) 's Twitter Profile Photo

Two months ahead of the usual annual peak of CO2 concentration in the atmosphere, parts per million in air exceeded 430. Comment from Ralph Keeling, director of the Scripps Institution of Oceanography CO2 program: "Crossing 430 ppm was...

Johan Rockström (@jrockstrom) 's Twitter Profile Photo

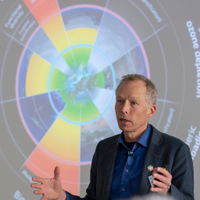
1.5°C isn’t a political target, but a physical limit. We’re set to exhaust the remaining carbon budget in just a few years. Yet policy assumes huge CO₂ removal later, instead of cutting fast now. 1st of 3 posts on Earth’s resilience & where we stand. linkedin.com/pulse/earth-lo…

Isabella M Weber (@isabellamweber) 's Twitter Profile Photo

Yes, but the Chinese never limited themselves to the American experience but conducted research on institutional arrangements in a wide variety of countries.

Ian Johnson (@iandenisjohnson) 's Twitter Profile Photo

One problem with potentially catastrophic consequences: only 1,105 U.S. students in China, down from 15,000 in 2015. No people in the pipeline to be diplomats, professors, CIA analysts, etc

Shweta (@shweta_journo) 's Twitter Profile Photo

As #COVID19 cases rise in #Asia, Dr. Soumya Swaminathan shares vital insights on #India's vaccination and surveillance strategies to stay ahead. youtu.be/kWfJvYx10Ac?fe… Soumya Swaminathan The Federal #COVID19 #Covid #covidnews

Jörg @kachelmann anderswo: @realkachelmann (@kachelmann) 's Twitter Profile Photo

Wir werden in den kommenden Jahren und Jahrzehnten öfter sehen, dass alpine Dörfer nicht mehr da sind. Klimawandel ist nicht, wenn es mal im Frühling weniger regnet oder jemand im Harz eine Kippe aus dem Fenster wirft. Klimawandel ist, wenn der Berg kommt, statt ruft.

Marion Koopmans, publications: https://pure.eur.nl (@marionkoopmans) 's Twitter Profile Photo

Comprehensive genomic study shows: The first and several subsequent omicron lineages originated from a small region in South Africa, in Gauteng province. Reasons not entirely clear but region has the largest number of cases with untreated HIV, authors say.

Prof. Matt England (@profmattengland) 's Twitter Profile Photo

Out today in Nature, our new paper on the drivers of the extreme summertime heating of the North Atlantic during 2023. Temperatures across much of the basin warmed to record high levels in the space of just a few months. The impacts on climate and ecosystems were severe. A thread

Out today in Nature, our new paper on the drivers of the extreme summertime heating of the North Atlantic during 2023. Temperatures across much of the basin warmed to record high levels in the space of just a few months. The impacts on climate and ecosystems were severe. A thread
NOAA Research (@noaaresearch) 's Twitter Profile Photo

JUST IN: Atmospheric carbon dioxide (CO2) concentrations have peaked for the year at 430.5 ppm.📈 This is 3.6 ppm higher than last year and the second largest May-May increase in the 67-year Mauna Loa record. In 2023, the CO2 peaked at 424 ppm. 🔗: gml.noaa.gov/ccgg/trends/

JUST IN: Atmospheric carbon dioxide (CO2) concentrations have peaked for the year at 430.5 ppm.📈
This is 3.6 ppm higher than last year and the second largest May-May increase in the 67-year Mauna Loa record. In 2023, the CO2 peaked at 424 ppm.
🔗: gml.noaa.gov/ccgg/trends/
Prof. Eliot Jacobson (@eliotjacobson) 's Twitter Profile Photo

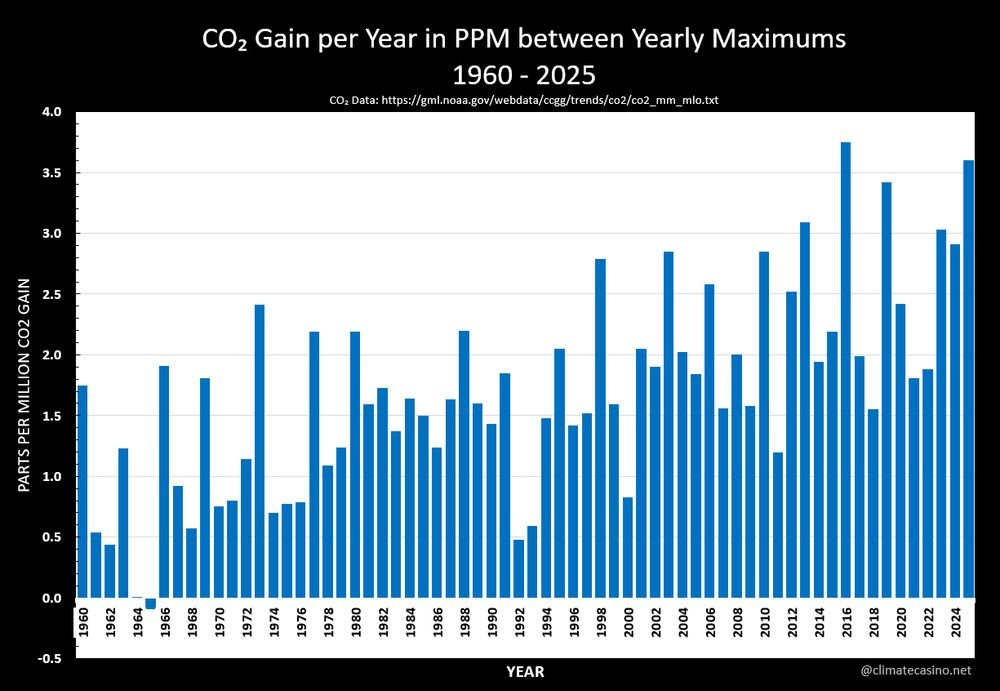
NOAA's May CO2 reading was 430.51 ppm Here I graph the gain (in ppm) between yearly maximums, where for each year I take the maximum CO2 for that year and subtract the maximum CO2 from the previous year. 2025 (3.60 ppm gain) came in second to 2016, (3.75 ppm gain).

NOAA's May CO2 reading was 430.51 ppm

Here I graph the gain (in ppm) between yearly maximums, where for each year I take the maximum CO2 for that year and subtract the maximum CO2 from the previous year. 

2025 (3.60 ppm gain) came in second to 2016, (3.75 ppm gain).
Prof. Eliot Jacobson (@eliotjacobson) 's Twitter Profile Photo

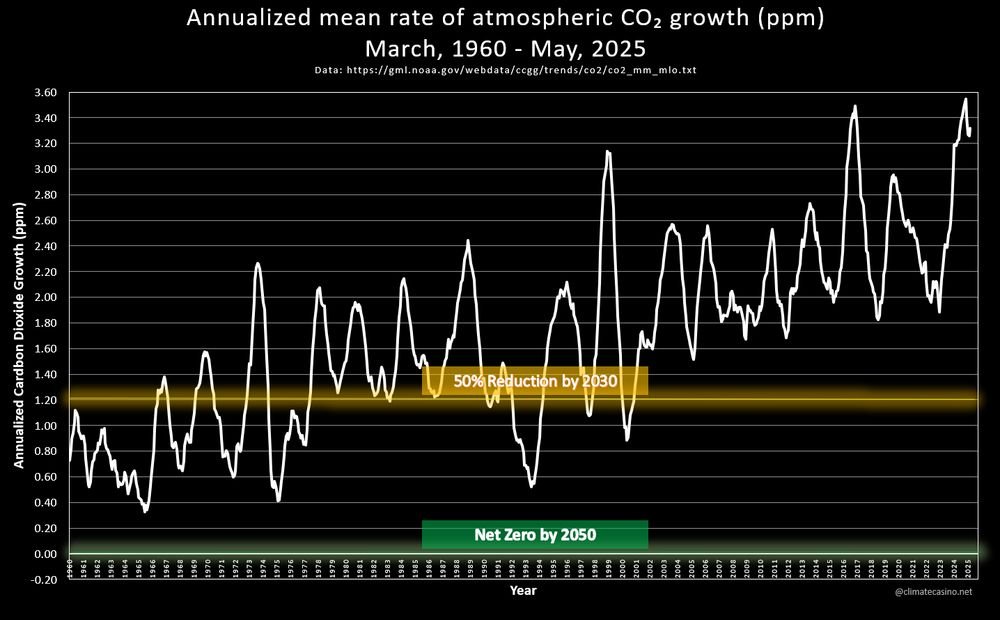
On an annualized basis, the rate of CO2 entering the atmosphere is increasing again. It's not a record, but things are definitely going in the wrong direction again ...

On an annualized basis, the rate of CO2 entering the atmosphere is increasing again. It's not a record, but things are definitely going in the wrong direction again ...
Xu Zou (@xz_keg) 's Twitter Profile Photo

Recently, a lot of undersampled regions start uploading seqs again. We're now seeing recent seqs from India, Pakistan, Bangladesh, Thailand, Nigeria, Cambodia, Vietnam. These sequences really provide a lot of information.