Amila Welihinda (@amilajack) 's Twitter Profile
Amila Welihinda

@amilajack

Building @palette_dev -- Next-gen web performance monitoring

ID: 2970738590

linkhttps://github.com/amilajack calendar_today10-01-2015 00:53:55

835 Tweet

11,11K Followers

1,1K Following

Amila Welihinda (@amilajack) 's Twitter Profile Photo

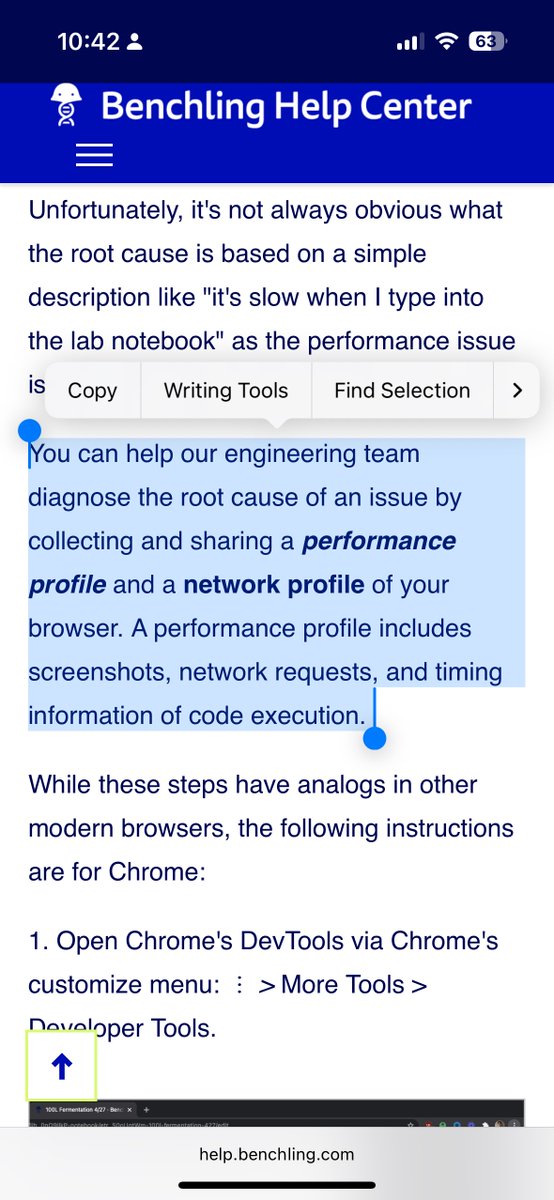
asking users to profile slow user experiences is a failure in web observability that we've normalized. below is Benchling, a $6B company with ~250 engineers. and they're not alone

asking users to profile slow user experiences is a failure in web observability that we've normalized.

below is Benchling, a $6B company with ~250 engineers. and they're not alone
Amila Welihinda (@amilajack) 's Twitter Profile Photo

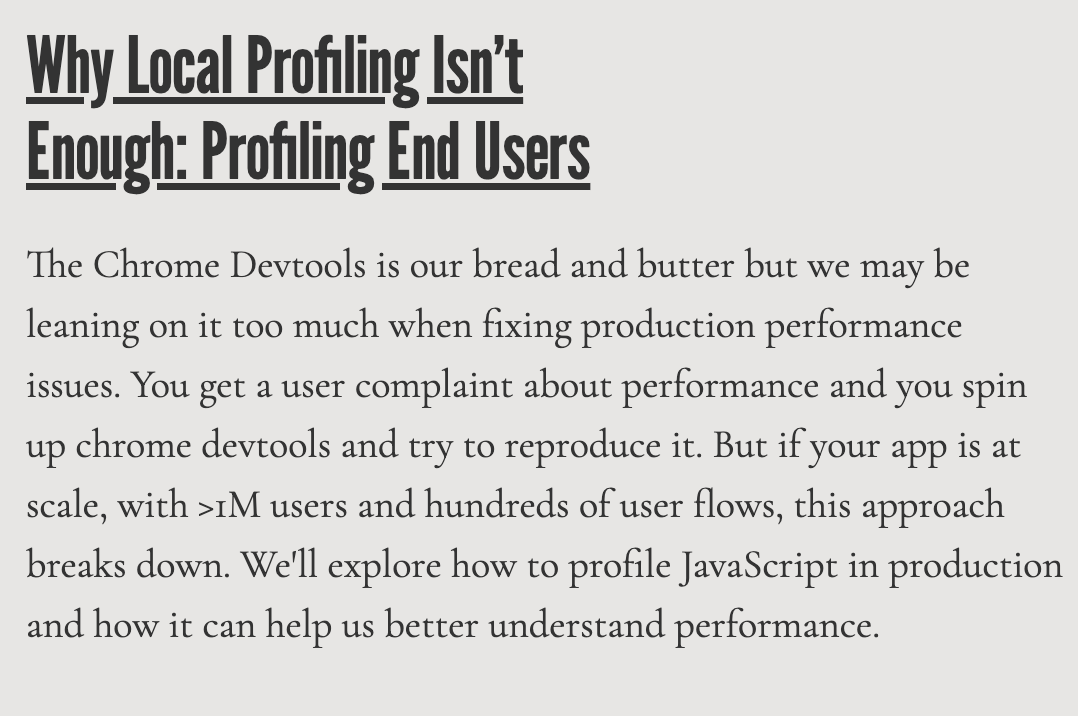
I'm speaking tomorrow at PerformanceObserver tomorrow 9AM PT about why local Chrome Devtools JS profiling isn't enough for fixing performance issues and how profiling end users can help. The Chrome Devtools Profiler is web dev's bread and butter but it breaks down at scale, with

I'm speaking tomorrow at PerformanceObserver tomorrow 9AM PT about why local Chrome Devtools JS profiling isn't enough for fixing performance issues and how profiling end users can help.

The Chrome Devtools Profiler is web dev's bread and butter but it breaks down at scale, with
Amila Welihinda (@amilajack) 's Twitter Profile Photo

My talk "Why the Chrome Devtools Isn’t Enough: Profiling End Users" is out now! I go over: 1. Brief history of why web apps are slow 2. Why the Chrome Devtools isn't enough 3. Why and how to profile JS from end users Enjoy!

TypeScript (@typescript) 's Twitter Profile Photo

Today we're announcing previews of the native port of TypeScript! These nightly previews will be available on npm and the VS Code marketplace! npm install -D @​typescript/native-preview npx tsgo --version Read up more on our blog! devblogs.microsoft.com/typescript/ann…

Amila Welihinda (@amilajack) 's Twitter Profile Photo

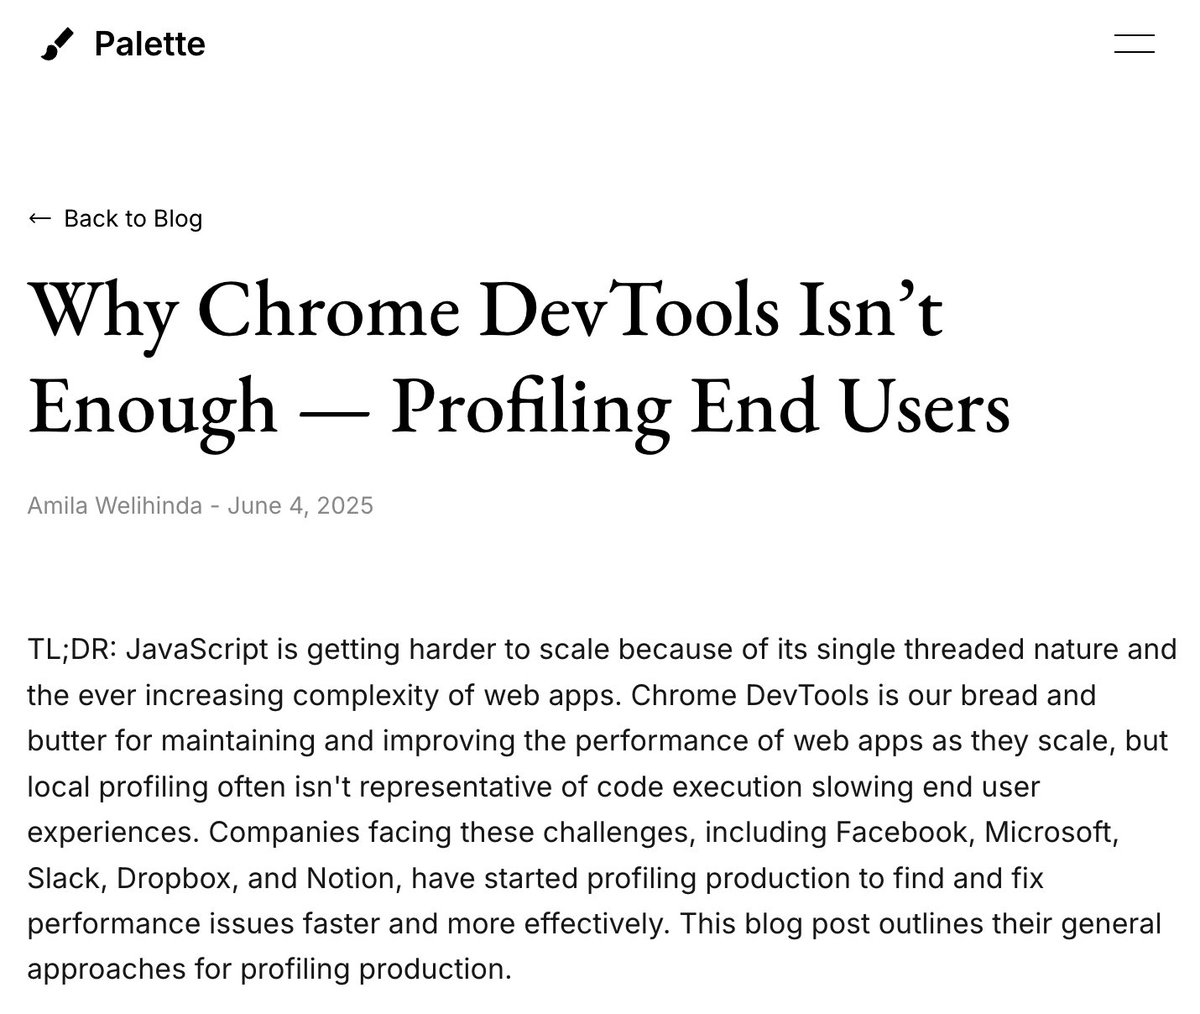
I wrote why Chrome Devtools isn't enough for fixing performance issues at scale. Chrome DevTools is our bread and butter but reproducing end user perf issues at scale using it is difficult and unreliable. Here're what Facebook and Slack are doing: palette.dev/blog/chrome-de…

Patrick Meenan (@patmeenan) 's Twitter Profile Photo

Interesting to see the services to make self-profiling easier become available beyond what the big companies have implemented in-house. Some of these browser capabilities have years before you start seeing adoption/ROI but deliver huge impact when it happens.

Amila Welihinda (@amilajack) 's Twitter Profile Photo

we want to make the web apps you use every day faster. to do that, we decided lower the barrier to production JS profiling so any web dev could have Facebook-level perf observability x.com/patmeenan/stat…

Amila Welihinda (@amilajack) 's Twitter Profile Photo

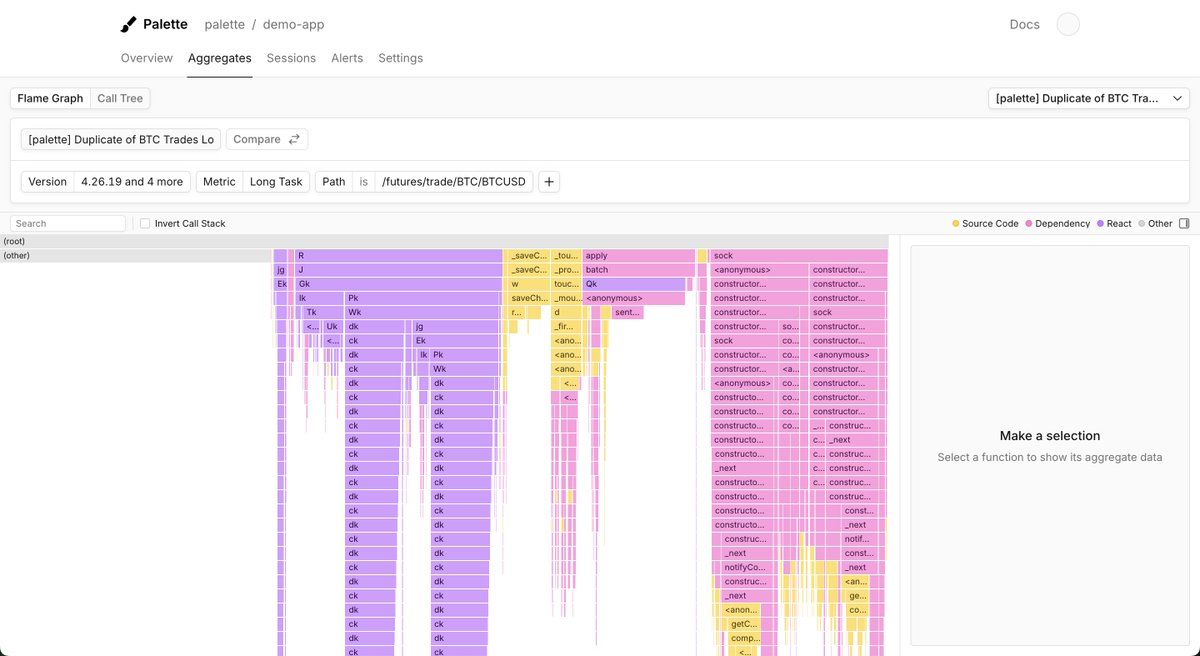
what a glow up after 1yr left is our end user JS profiling mvp called "hot functions", sorting functions by total time. right is today -- complete flamegraph supporting zoom/pan/filter

what a glow up after 1yr

left is our end user JS profiling mvp called "hot functions", sorting functions by total time. right is today -- complete flamegraph supporting zoom/pan/filter