Grid Status (@grid_status) 's Twitter Profile
Grid Status

@grid_status

Stay informed on the real-time status of the US Electric Grid with comprehensive monitoring and data

ID: 1558466439396397057

linkhttps://www.gridstatus.io/ calendar_today13-08-2022 14:52:16

462 Tweet

7,7K Followers

214 Following

Grid Status (@grid_status) 's Twitter Profile Photo

Today, we are launching Grid Status on SnowflakeDB Marketplace! Get instant access to 200+ power market and electric grid datasets that are curated and maintained by our team of experts. Reach out for a free evaluation

Today, we are launching Grid Status on <a href="/SnowflakeDB/">SnowflakeDB</a> Marketplace!

Get instant access to 200+ power market and electric grid datasets that are curated and maintained by our team of experts.

Reach out for a free evaluation
Grid Status (@grid_status) 's Twitter Profile Photo

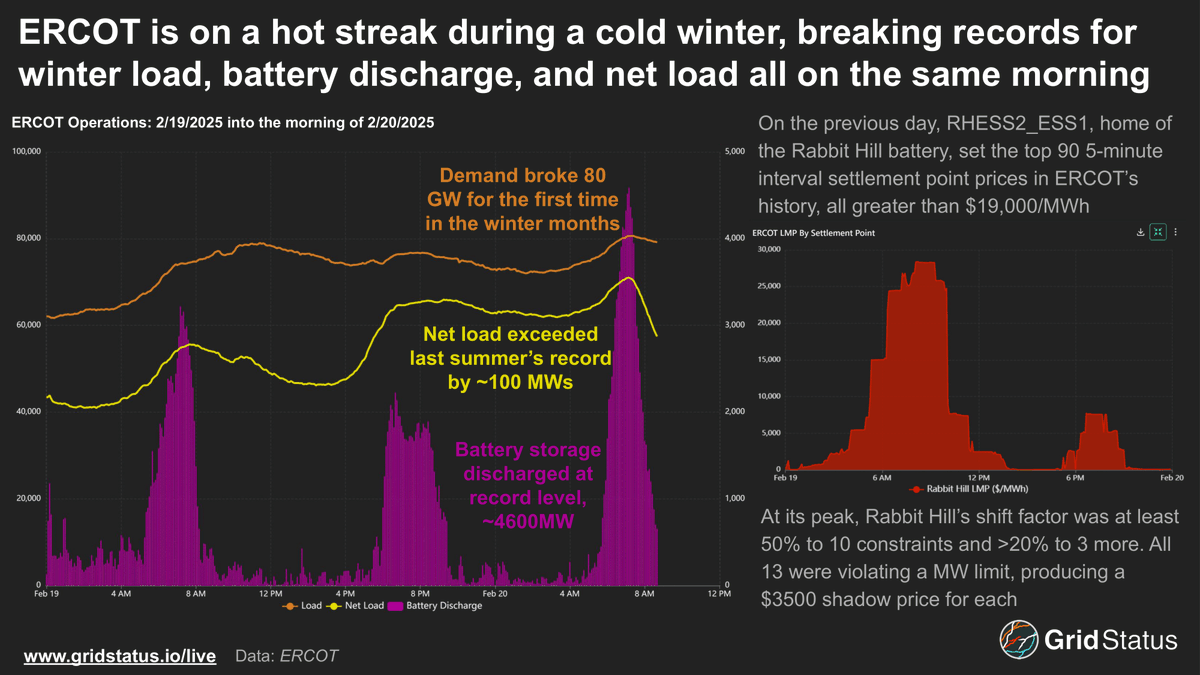
It’s been a record-breaking week in ERCOT. Let’s analyze how cold weather, load growth, and new generation sources are creating conditions never before seen in Texas. ERCOT broke its record winter peak yesterday and today, culminating in a new record above 80 GW for the first

It’s been a record-breaking week in ERCOT. Let’s analyze how cold weather, load growth, and new generation sources are creating conditions never before seen in Texas.

ERCOT broke its record winter peak yesterday and today, culminating in a new record above 80 GW for the first
Grid Status (@grid_status) 's Twitter Profile Photo

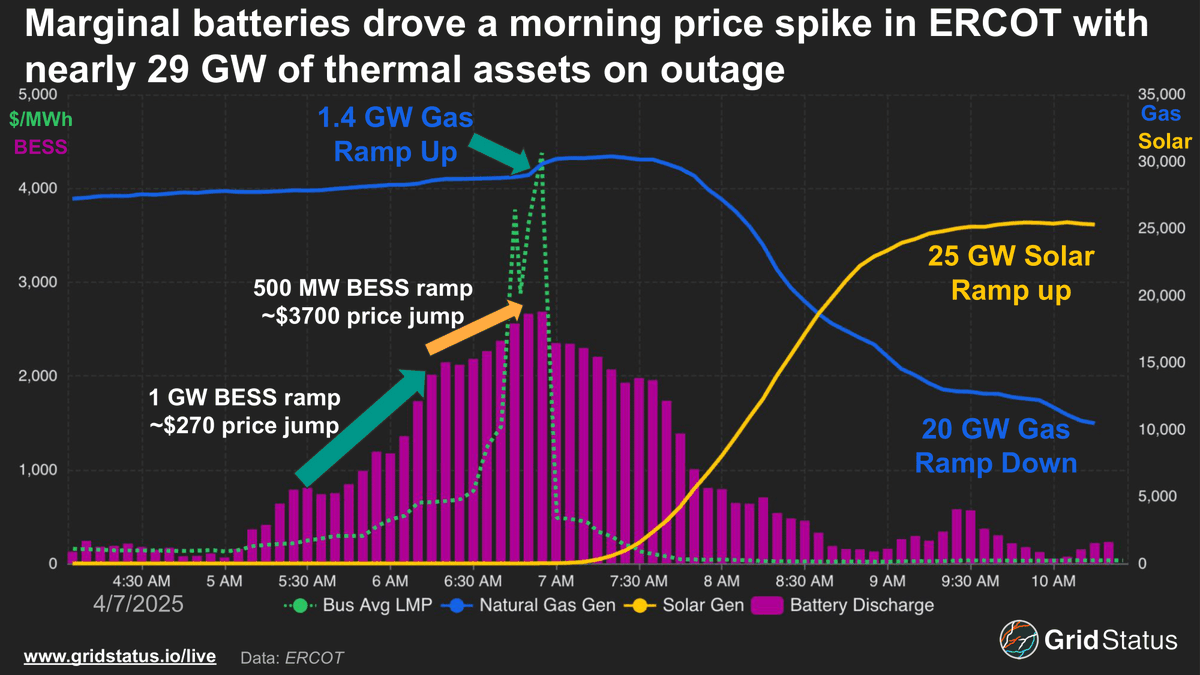
Prices spiked in ERCOT this morning, mostly driven by the cost of energy from marginal batteries We're in the depths of outage season with many thermal assets out for maintenance. In those conditions, even a modest morning load forecast beat can lead to a quick run up the supply

Prices spiked in ERCOT this morning, mostly driven by the cost of energy from marginal batteries

We're in the depths of outage season with many thermal assets out for maintenance. In those conditions, even a modest morning load forecast beat can lead to a quick run up the supply
John Arnold (@johnarnoldfndtn) 's Twitter Profile Photo

This is the fuel mix in ERCOT (Texas) for the past week (top) vs same week 4 years ago (bottom). Solar generation is in yellow. Solar barely registered in 2021; today it accounts for roughly 50% of generation during the day in the shoulder months. data via Grid Status

This is the fuel mix in ERCOT (Texas) for the past week (top) vs same week 4 years ago (bottom). Solar generation is in yellow. Solar barely registered in 2021; today it accounts for roughly 50% of generation during the day in the shoulder months.
data via <a href="/grid_status/">Grid Status</a>
Chris Gillett (@chris_gillett0) 's Twitter Profile Photo

The Grid Status snowflake DB is so powerful. This query gets every generator's output (MW), resource node price ($/MWh), and therefore revenue for every SCED interval in 2024... in 3.5 minutes. Any visualization requests?

The <a href="/grid_status/">Grid Status</a> snowflake DB is so powerful.

This query gets every generator's output (MW),  resource node price ($/MWh), and therefore revenue for every SCED interval in 2024... in 3.5 minutes.

Any visualization requests?
Max Kanter (@maxk) 's Twitter Profile Photo

About to release a new Forecast Analysis app on Grid Status , and I’m looking for users to test it. Not only does it make pretty visualizations, it helps you understand how forecast vintages evolve over time, compare their historical accuracy, and more. DM or reply for link!

About to release a new Forecast Analysis app on <a href="/grid_status/">Grid Status</a> , and I’m looking for users to test it.

Not only does it make pretty visualizations, it helps you understand how forecast vintages evolve over time, compare their historical accuracy, and more. 

DM or reply for link!
Grid Status (@grid_status) 's Twitter Profile Photo

🔥This week saw 72 hours of extreme temps in the Eastern US — here’s how they impacted electricity prices in 60 seconds. It was a clear reminder: summer risk isn’t going anywhere, and cooling for those new demand centers only gets more difficult as temperatures rise.

John Arnold (@johnarnoldfndtn) 's Twitter Profile Photo

Good illustration of how much the Texas grid has changed in just 6 years. yellow = solar; purple = batteries; dark green = wind; blue = gas; brown = coal; light green = nuke via Grid Status

Good illustration of how much the Texas grid has changed in just 6 years. 
yellow = solar; purple = batteries; dark green = wind; blue = gas; brown = coal; light green = nuke

via <a href="/grid_status/">Grid Status</a>