Joseph (@joseph_barbier) 's Twitter Profile
Joseph

@joseph_barbier

I'm a freelance data scientist
- living in France 🥖
- doing open source 🐍
- and data visualization 📈

ID: 2824519917

linkhttps://barbierjoseph.com calendar_today12-10-2014 07:21:56

223 Tweet

667 Followers

39 Following

Yan Holtz (@r_graph_gallery) 's Twitter Profile Photo

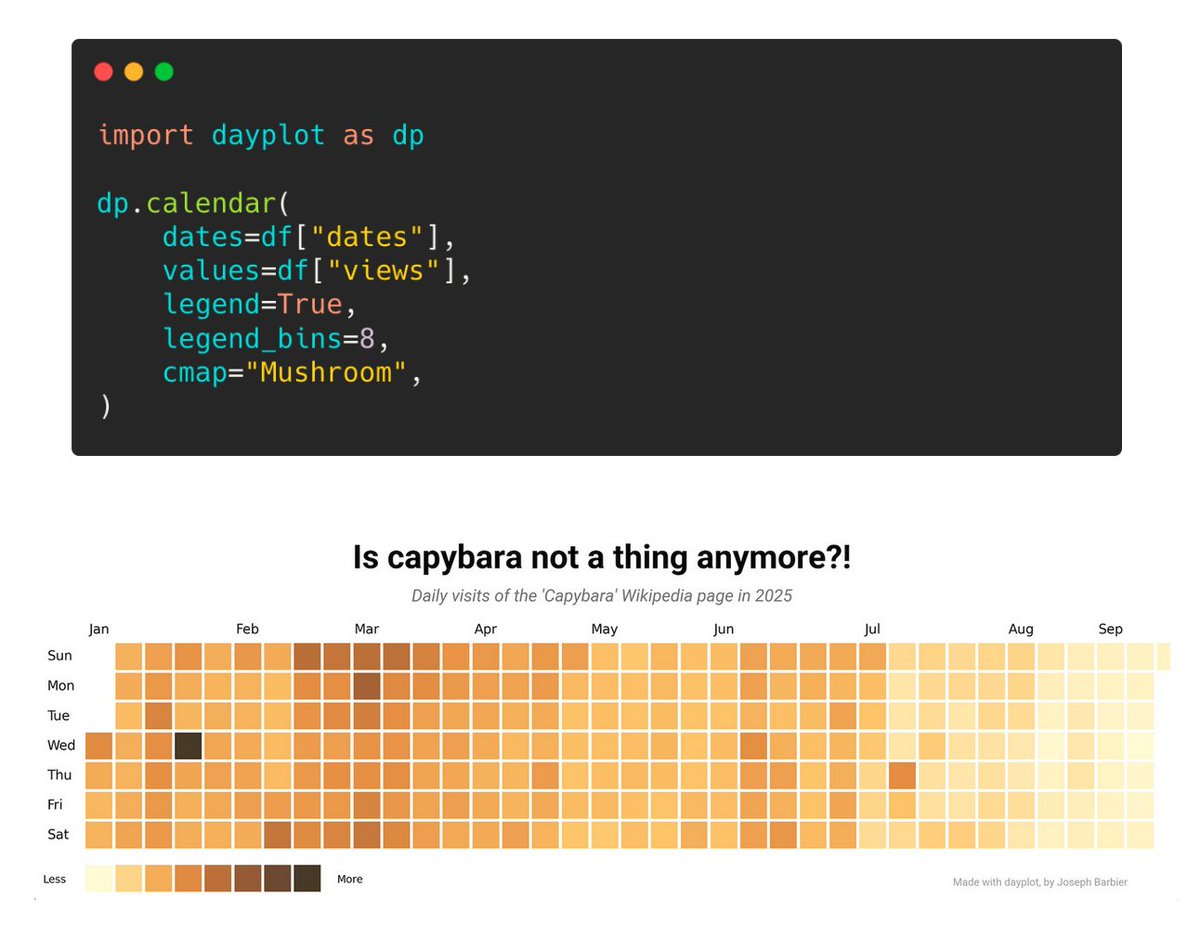
It's now incredibly easy to build calendar heatmaps! Thanks Joseph for your dayplot library! Documentation: josephbarbierdarnal.github.io/dayplot/tuto/a… If you like making charts with Python, come learn with us at matplotlib-journey.com!

It's now incredibly easy to build calendar heatmaps!

Thanks <a href="/joseph_barbier/">Joseph</a> for your dayplot library!

Documentation:
josephbarbierdarnal.github.io/dayplot/tuto/a…

If you like making charts with Python, come learn with us at matplotlib-journey.com!
Joseph (@joseph_barbier) 's Twitter Profile Photo

New (small) release of dayplot 📅 It's now possible to specify the first day of the week (which is Sunday by default) thanks to Ali Shakiba! Learn more: josephbarbierdarnal.github.io/dayplot/ Github repo: github.com/JosephBARBIERD…

New (small) release of dayplot 📅

It's now possible to specify the first day of the week (which is Sunday by default) thanks to Ali Shakiba!

Learn more: josephbarbierdarnal.github.io/dayplot/

Github repo: github.com/JosephBARBIERD…
Joseph (@joseph_barbier) 's Twitter Profile Photo

TLDR: I'm working on making pyfonts much faster 🏃‍♀️ pyfonts is a little python package I've created to make using fonts in Matplotlib easy and reproducible. It suffers from being too slow when using multiple fonts, but this will be resolved soon! Repo: lnkd.in/gRDMrgF7
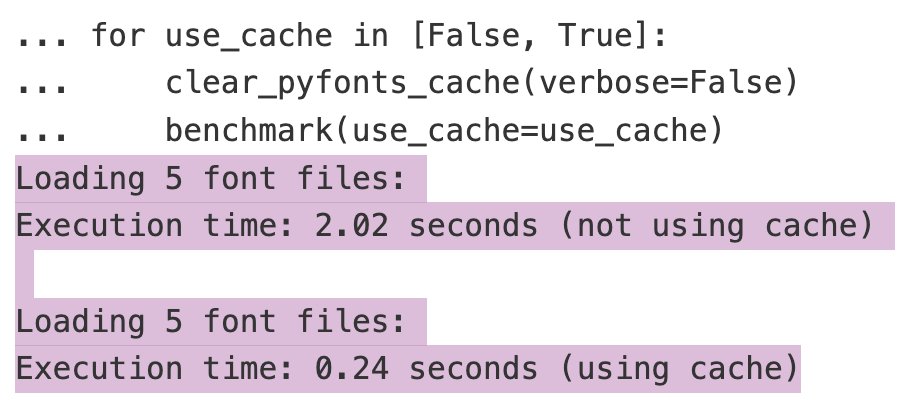
TLDR: I'm working on making pyfonts much faster 🏃‍♀️

pyfonts is a little python package I've created to make using fonts in <a href="/matplotlib/">Matplotlib</a> easy and reproducible.

It suffers from being too slow when using multiple fonts, but this will be resolved soon!

Repo: lnkd.in/gRDMrgF7
Joseph (@joseph_barbier) 's Twitter Profile Photo

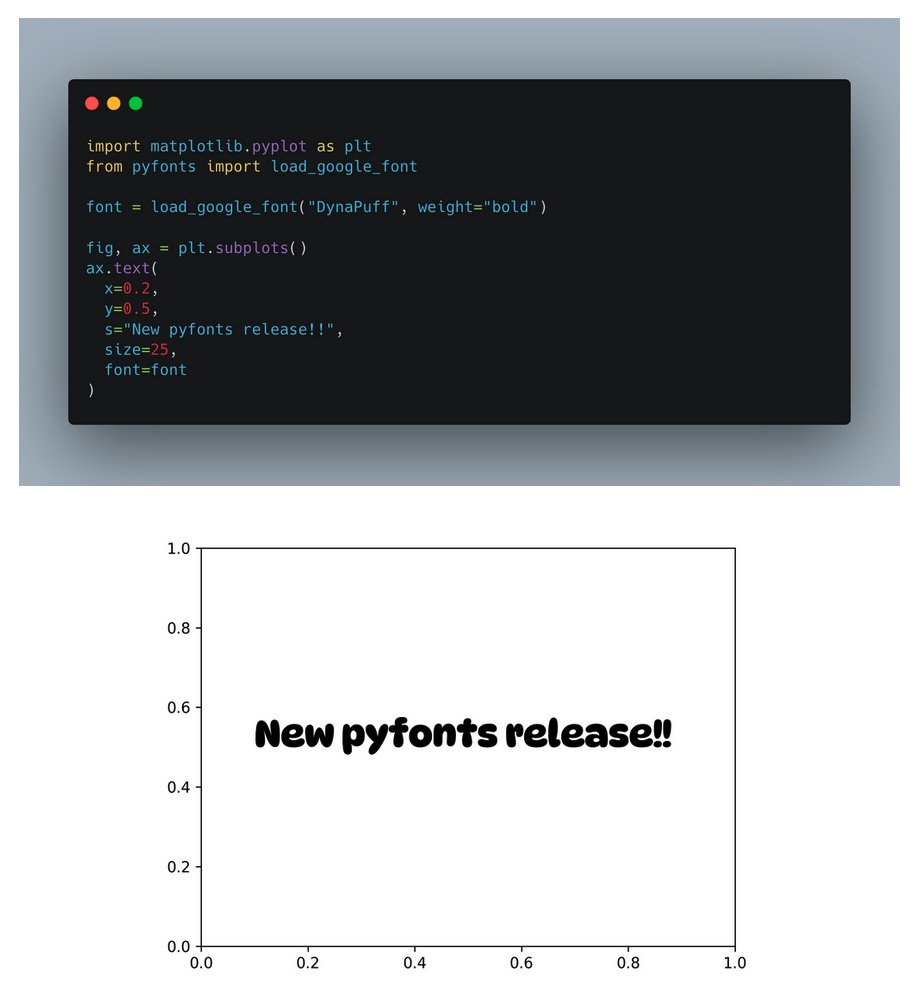
New major release of pyfonts! 😁 It’s now possible (and super easy) to use ALL fonts from Google Fonts with just a single line of code and apply them in matplotlib. Learn more: josephbarbierdarnal.github.io/pyfonts/ Github: github.com/JosephBARBIERD…

New major release of pyfonts! 😁

It’s now possible (and super easy) to use ALL fonts from Google Fonts with just a single line of code and apply them in matplotlib.

Learn more: josephbarbierdarnal.github.io/pyfonts/

Github: github.com/JosephBARBIERD…
Joseph (@joseph_barbier) 's Twitter Profile Photo

Why do most data science side projects have zero value? For many reasons: - Not reproducible - Not easy to browse - Lacking a clear narrative - Not visually appealing Just published a new blog post on how to do a data science project: barbierjoseph.com/blog/how-not-t…

Joseph (@joseph_barbier) 's Twitter Profile Photo

Is there an equivalent to R CMD CHECK, but for python? ruff/uv do most of the work here, but I still feel like there's a lack of a single, very verbose tool for doing diagnostics in a python package.

Joseph (@joseph_barbier) 's Twitter Profile Photo

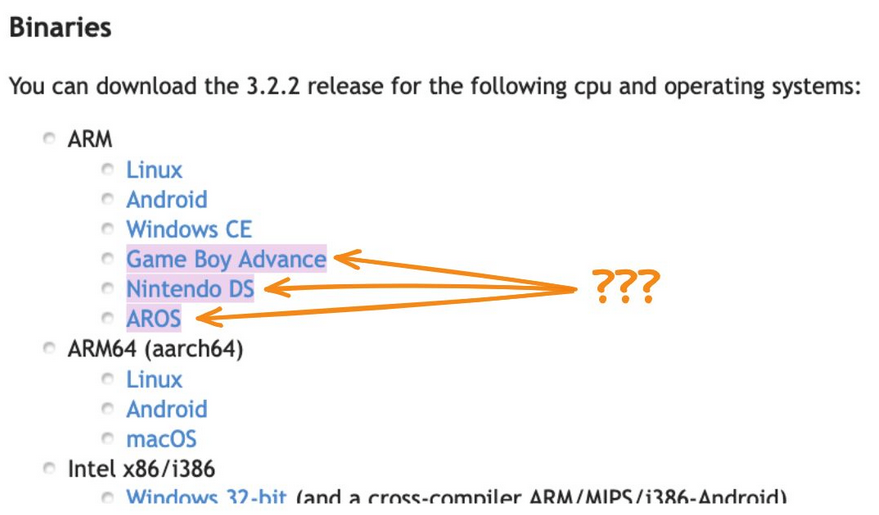
I was looking to install a Pascal compiler earlier and found out that, apparently, some people take "cross-platform" very seriously. Now I’m wondering if I should try to make my statistics program run on my old GBA just to make it truly cross-platform.

I was looking to install  a Pascal compiler earlier and found out that, apparently, some people  take "cross-platform" very seriously.

Now I’m wondering if I should try to make my statistics program run on my old GBA just to make it truly cross-platform.
Joseph (@joseph_barbier) 's Twitter Profile Photo

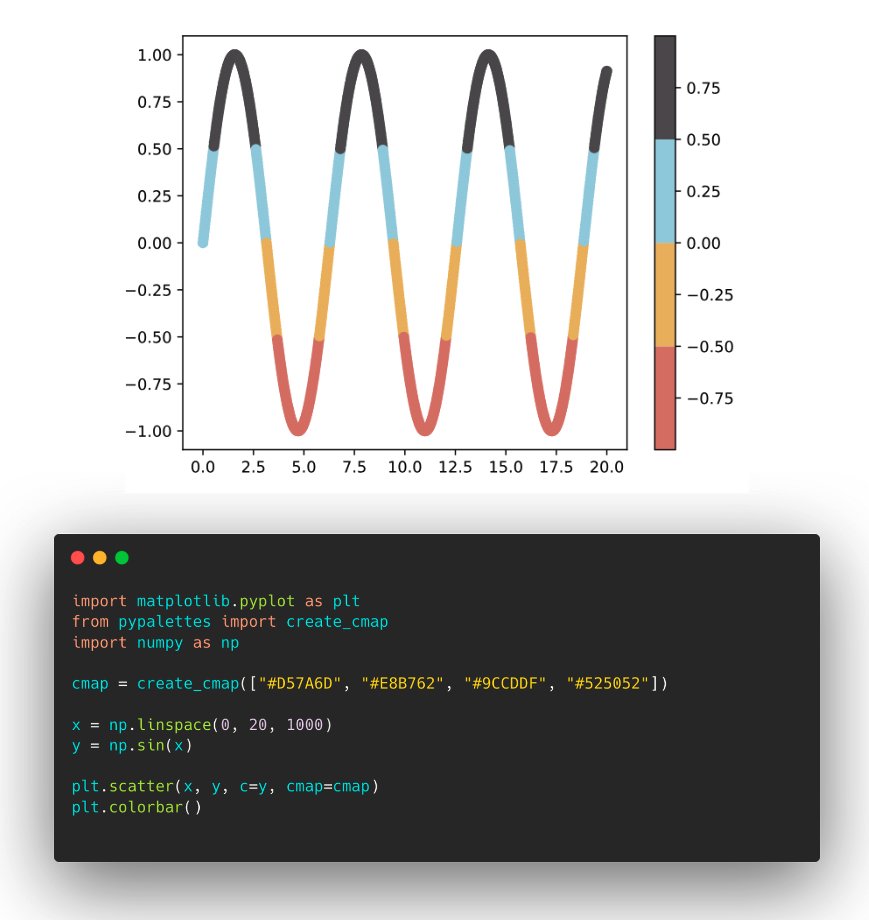
New (small) release of pypalettes! 😁 - A create_cmap() function to easily create a colormap object - A show_cmap() function to preview the colors - Improved documentation - Minor bug fixes and internal code cleanup More info on the project repository: github.com/JosephBARBIERD…

New (small) release of pypalettes! 😁

- A create_cmap() function to easily create a colormap object
- A show_cmap() function to preview the colors
- Improved documentation
- Minor bug fixes and internal code cleanup

More info on the project repository: github.com/JosephBARBIERD…
Joseph (@joseph_barbier) 's Twitter Profile Photo

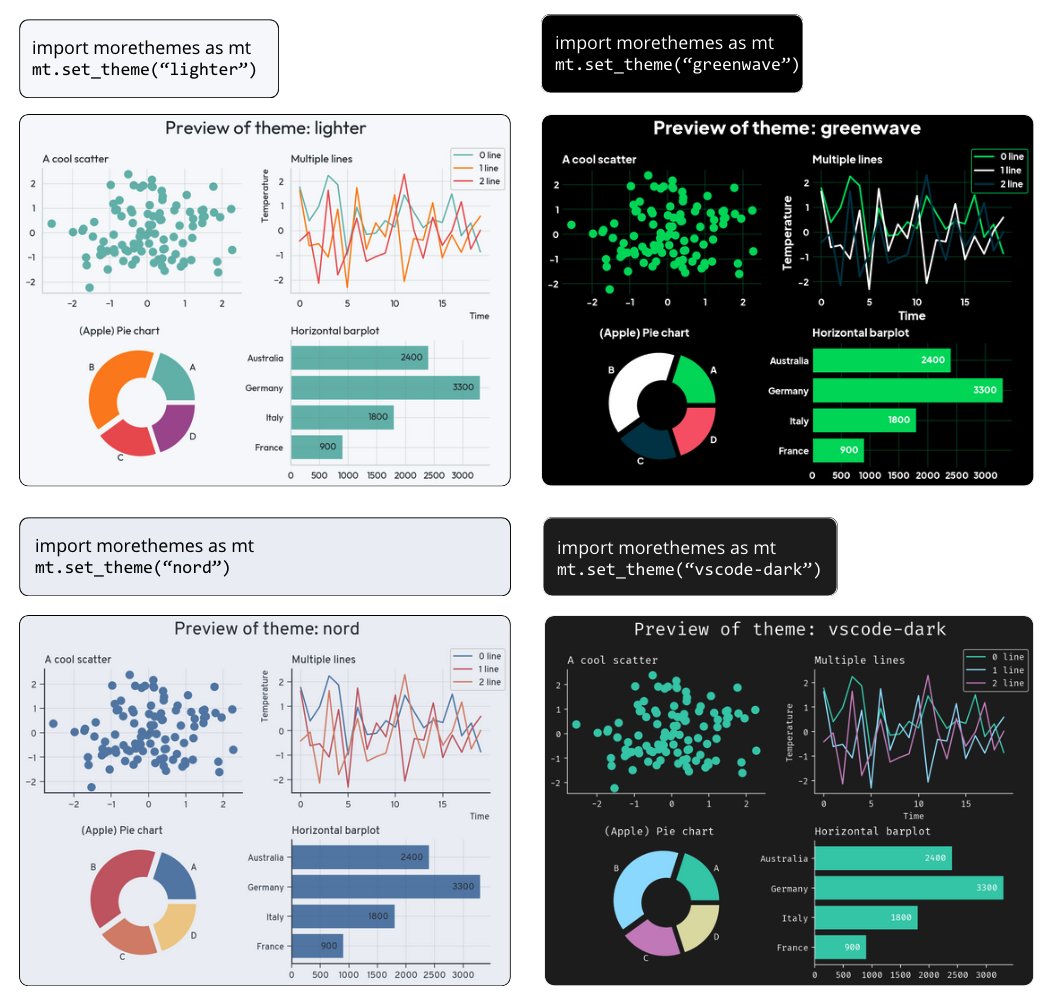
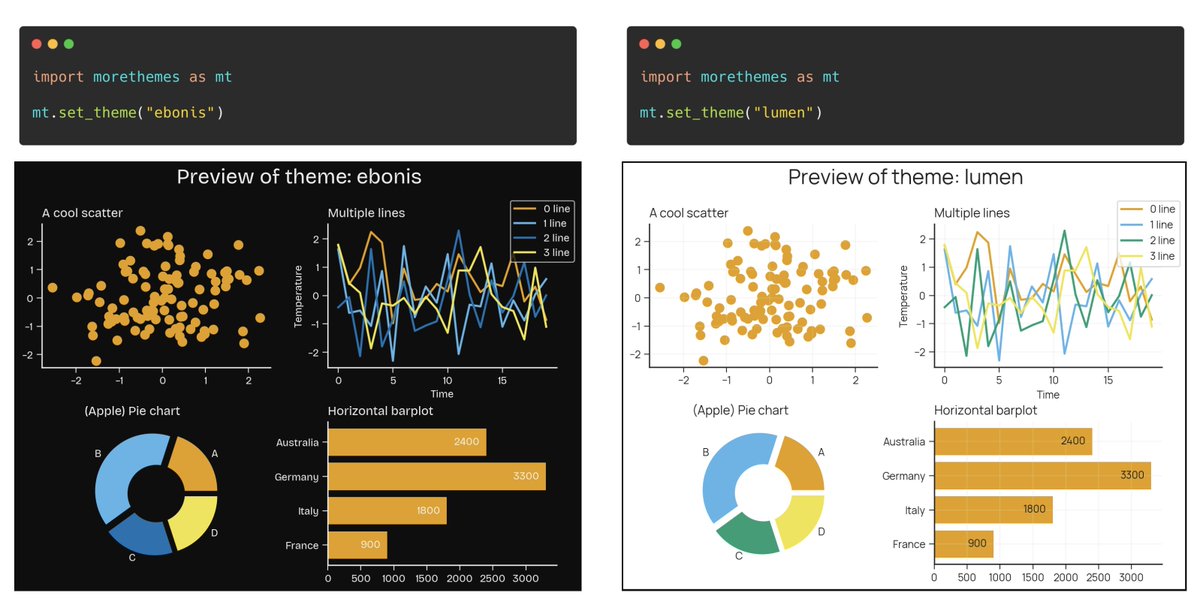
New morethemes release! 🎨 4 new themes added (14 total now!) in morethemes, a Python package offering beautiful, ready-to-use styles for matplotlib. Feedback, stars, or suggestions welcome! Learn more: github.com/JosephBARBIERD…

New morethemes release! 🎨

4 new themes added (14 total now!) in morethemes, a Python package offering beautiful, ready-to-use styles for matplotlib.

Feedback, stars, or suggestions welcome!

Learn more: github.com/JosephBARBIERD…
Joseph (@joseph_barbier) 's Twitter Profile Photo

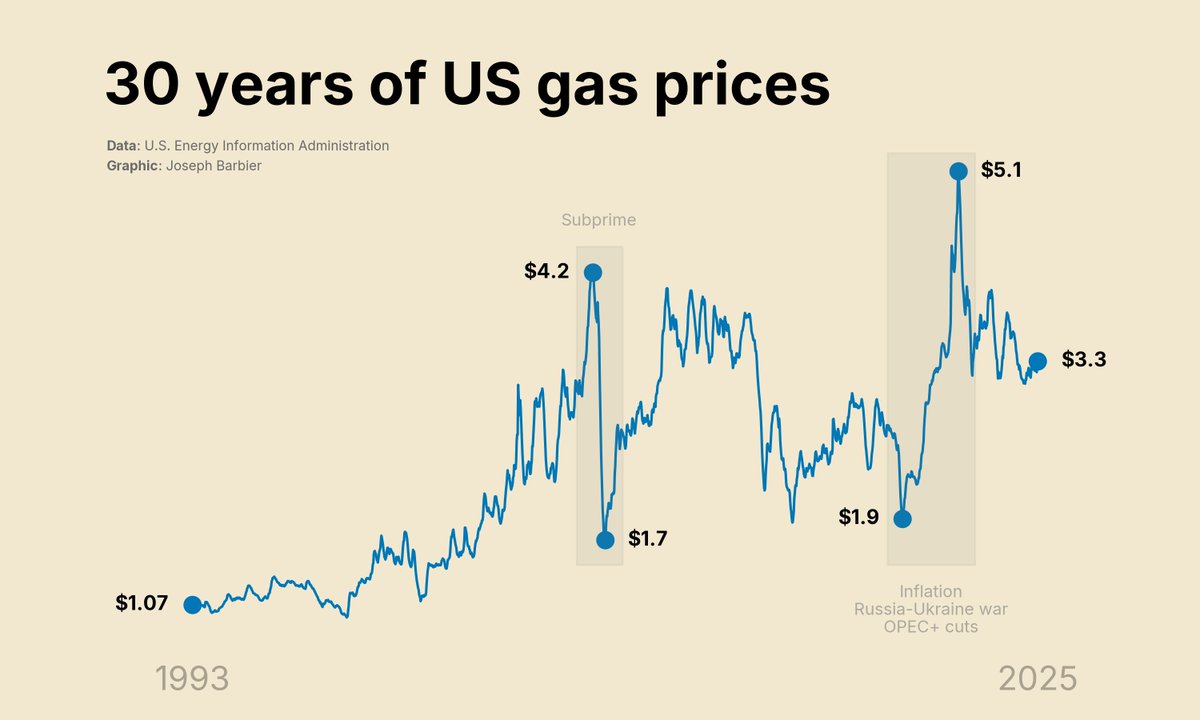
New #tidytuesday chart! It's all about gas prices • Highlight the overall trend rather than precise values • Use a scale-free format • Keep the design minimalist Code: github.com/JosephBARBIERD…

New #tidytuesday chart! It's all about gas prices

• Highlight the overall trend rather than precise values
• Use a scale-free format
• Keep the design minimalist

Code: github.com/JosephBARBIERD…
Joseph (@joseph_barbier) 's Twitter Profile Photo

I've started working on a minimalist PoC that converts Matplotlib plots into interactive graphics. There are a bazillion things to do before it's something robust and stable, but I'm confident it will go somewhere. Online demo: y-sunflower.github.io/plotjs/

Joseph (@joseph_barbier) 's Twitter Profile Photo

New release of pyfonts, with a really cool new feature! You can now change the default font globally, instead of having to manually change all the text fonts. Thanks John Gardner who implemented this 😁 Feedback, stars, or suggestions welcome! Github: github.com/JosephBARBIERD…

New release of pyfonts, with a really cool new feature!

You can now change the default font globally, instead of having to manually change all the text fonts.

Thanks John Gardner who implemented this 😁

Feedback, stars, or suggestions welcome!

Github: github.com/JosephBARBIERD…
Joseph (@joseph_barbier) 's Twitter Profile Photo

It's been a year since I started freelancing! So I decided to write a little blog post about the upsides and downsides. It focuses mainly on: money, workload and working conditions. barbierjoseph.com/blog/lessons-a…

Joseph (@joseph_barbier) 's Twitter Profile Photo

New release of morethemes 😁🎨 with 2 new themes for matplotlib! These themes (try to) be more color-blind friendly, as requested by some users. If you have any ideas for themes, please don't hesitate to reach out! Browse all themes: y-sunflower.github.io/morethemes/

New release of morethemes 😁🎨 with 2 new themes for matplotlib!

These themes (try to) be more color-blind friendly, as requested by some users.

If you have any ideas for themes, please don't hesitate to reach out!

Browse all themes: y-sunflower.github.io/morethemes/
Joseph (@joseph_barbier) 's Twitter Profile Photo

New feature available in dayplot! 📅 You can now easily add captions (and customize them) to the calendar heatmaps. Now, I think it's time for me to spend more time finding better examples. Learn more about dayplot: github.com/y-sunflower/da…

New feature available in dayplot! 📅

You can now easily add captions (and customize them) to the calendar heatmaps.

Now, I think it's time for me to spend more time finding better examples.

Learn more about dayplot: github.com/y-sunflower/da…
Joseph (@joseph_barbier) 's Twitter Profile Photo

Introducing ✨bumplot✨, a brand new Python package for creating bump charts! It's: - super easy to use - super easy to customize - super cool (obviously) - built on top of Matplotlib Learn more about bumplot: github.com/y-sunflower/bu…

Introducing ✨bumplot✨, a brand new Python package for creating bump charts!

It's:
- super easy to use
- super easy to customize
- super cool (obviously)
- built on top of <a href="/matplotlib/">Matplotlib</a>

Learn more about bumplot: github.com/y-sunflower/bu…
Yan Holtz (@r_graph_gallery) 's Twitter Profile Photo

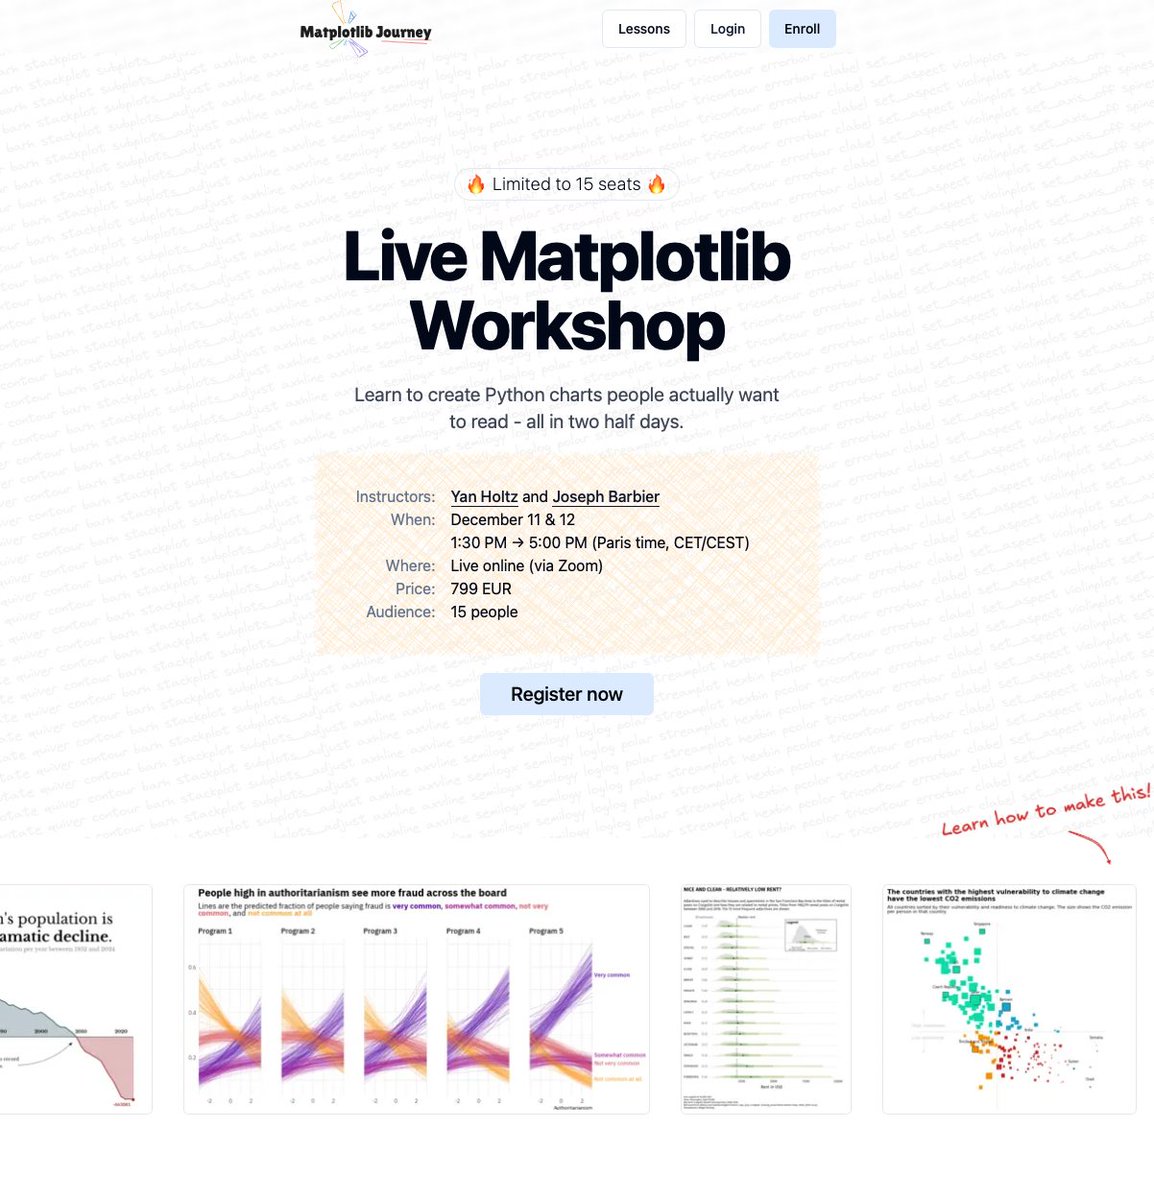
🎉 Want to build better charts with #Python and Matplotlib ? Join me and Joseph for a brand new #dataviz workshop! We’ll spend 2 half-days together, alternating between impactful explanations and hands-on exercises. Only 15 spots available! matplotlib-journey.com/workshop

🎉 Want to build better charts with #Python and <a href="/matplotlib/">Matplotlib</a> ?

Join me and <a href="/joseph_barbier/">Joseph</a> for a brand new #dataviz workshop!

We’ll spend 2 half-days together, alternating between impactful explanations and hands-on exercises.

Only 15 spots available!

matplotlib-journey.com/workshop