Mark Parrington (@m_parrington) 's Twitter Profile
Mark Parrington

@m_parrington

Senior scientist Copernicus Atmosphere Monitoring Service @CopernicusECMWF @ECMWF working on global #wildfires #airquality #atmoschem & #scicomm

ID: 2870274093

linkhttps://atmosphere.copernicus.eu calendar_today10-11-2014 08:59:31

19,19K Tweet

13,13K Followers

7,7K Following

Mark Parrington (@m_parrington) 's Twitter Profile Photo

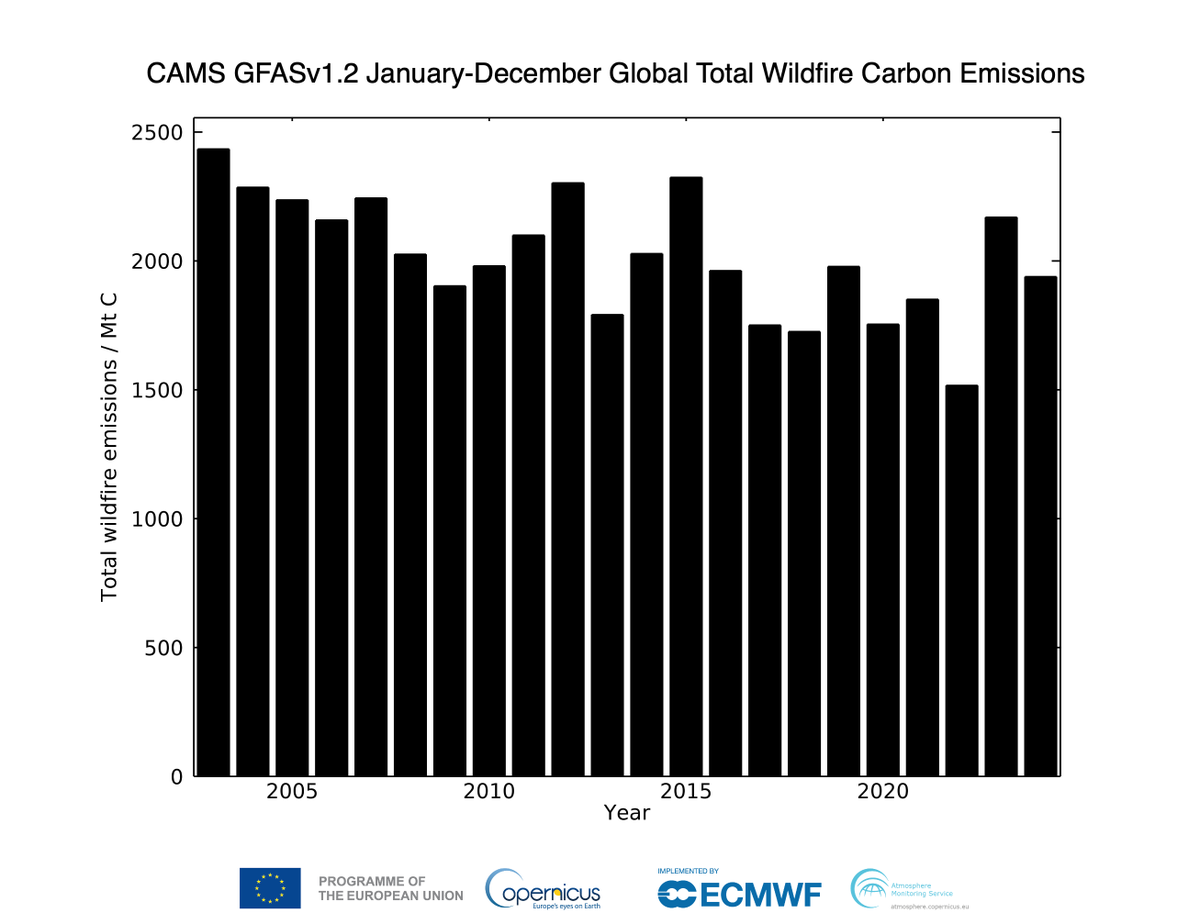
Global #wildfires #openburning intensity & emissions for December 2024 in #CopernicusAtmosphere Monitoring Service GFAS data ads.atmosphere.copernicus.eu/datasets/cams-…. Mostly seasonal tropical fires & lowest Dec total. Annual total again increased wrt 2 decade downward trend but < 2023

Global #wildfires #openburning intensity &amp; emissions for December 2024 in #CopernicusAtmosphere  Monitoring Service GFAS data ads.atmosphere.copernicus.eu/datasets/cams-…. Mostly seasonal tropical fires &amp; lowest Dec total. Annual total again increased wrt 2 decade downward trend but &lt; 2023
ESA Earth Observation (@esa_eo) 's Twitter Profile Photo

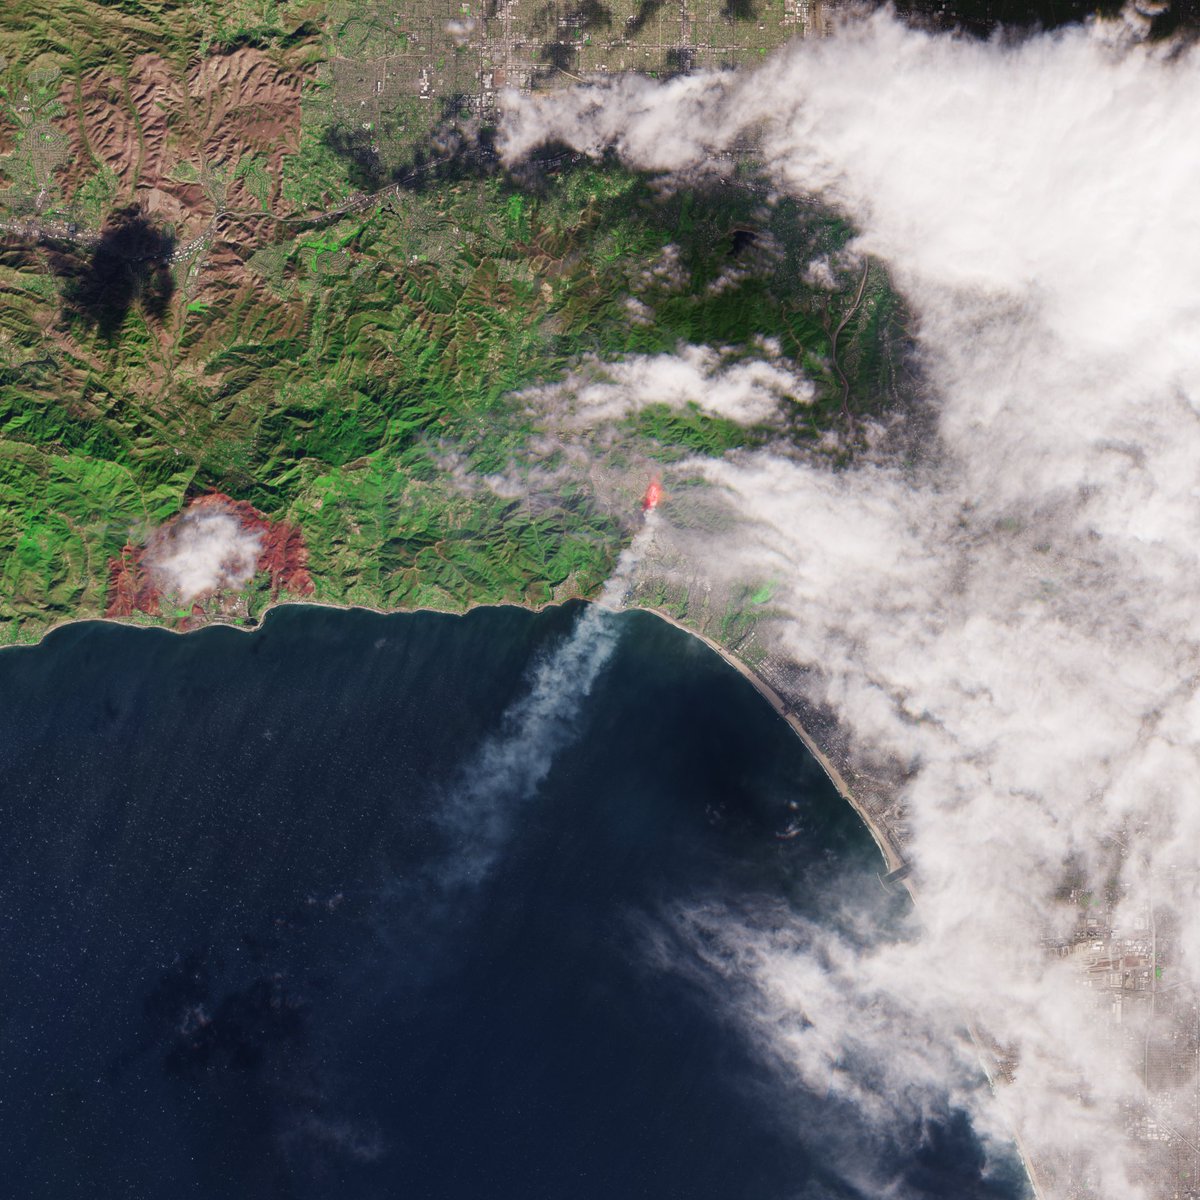
Wildfires 🔥 ripping through the Pacific Palisades in Los Angeles, California. This image captured by the Copernicus Sentinel-2 mission depicts the smoke billowing from the fire near Santa Monica at 10:36 local time on 7 January 2025, not long after the fire broke out.

Wildfires 🔥 ripping through the Pacific Palisades in Los Angeles, California.

This image captured by the Copernicus Sentinel-2 mission depicts the smoke billowing from the fire near Santa Monica at 10:36 local time on 7 January 2025, not long after the fire broke out.
FIREPRIME (@fireprime_eu) 's Twitter Profile Photo

The dramatic fires in California show the need for a wildfire risk culture based on community preparedness and prevention. #FIREPRIME aims to contribute to this in Europe and thus ease the work of the civil protection services. 🤝

Matthew Cappucci (@matthewcappucci) 's Twitter Profile Photo

It you live in Los Angeles, shut your windows and turn off your vents to the outside — the air quality is hazardous. You can visualize air quality in the MyRadar Weather map. The bull’s eye of hazardous air is directly over the nation’s second-largest city.

NOAA Satellites (@noaasatellites) 's Twitter Profile Photo

The devastating #PalisadesFire and #EatonFire continue to burn across parts of southern California today. This imagery from NOAA's #GOESWest (GOES-18) 🛰️ shows the smoke and heat signatures from the #wildfires from Jan. 7-8, 2025.

Simon Proud (@simon_sat) 's Twitter Profile Photo

The #PalisadeFire in California, USA, seen from ignition yesterday until sunrise today. Seen by the NOAA Satellites GOES-18 weather sat, a vital tool for monitoring these fires. Really dreadful situation - and several other fires pop up as well. Firefighters have a hard task.
CAL FIRE (@cal_fire) 's Twitter Profile Photo

🔥 CAL FIRE is battling multiple wildfires across Southern California. Just eight days into 2025, there have been more than 55 wildfires. Here is a summary of the major fires burning in Southern California, including the #PalisadesFire and #EatonFire

ADAM Platform (@platformadam) 's Twitter Profile Photo

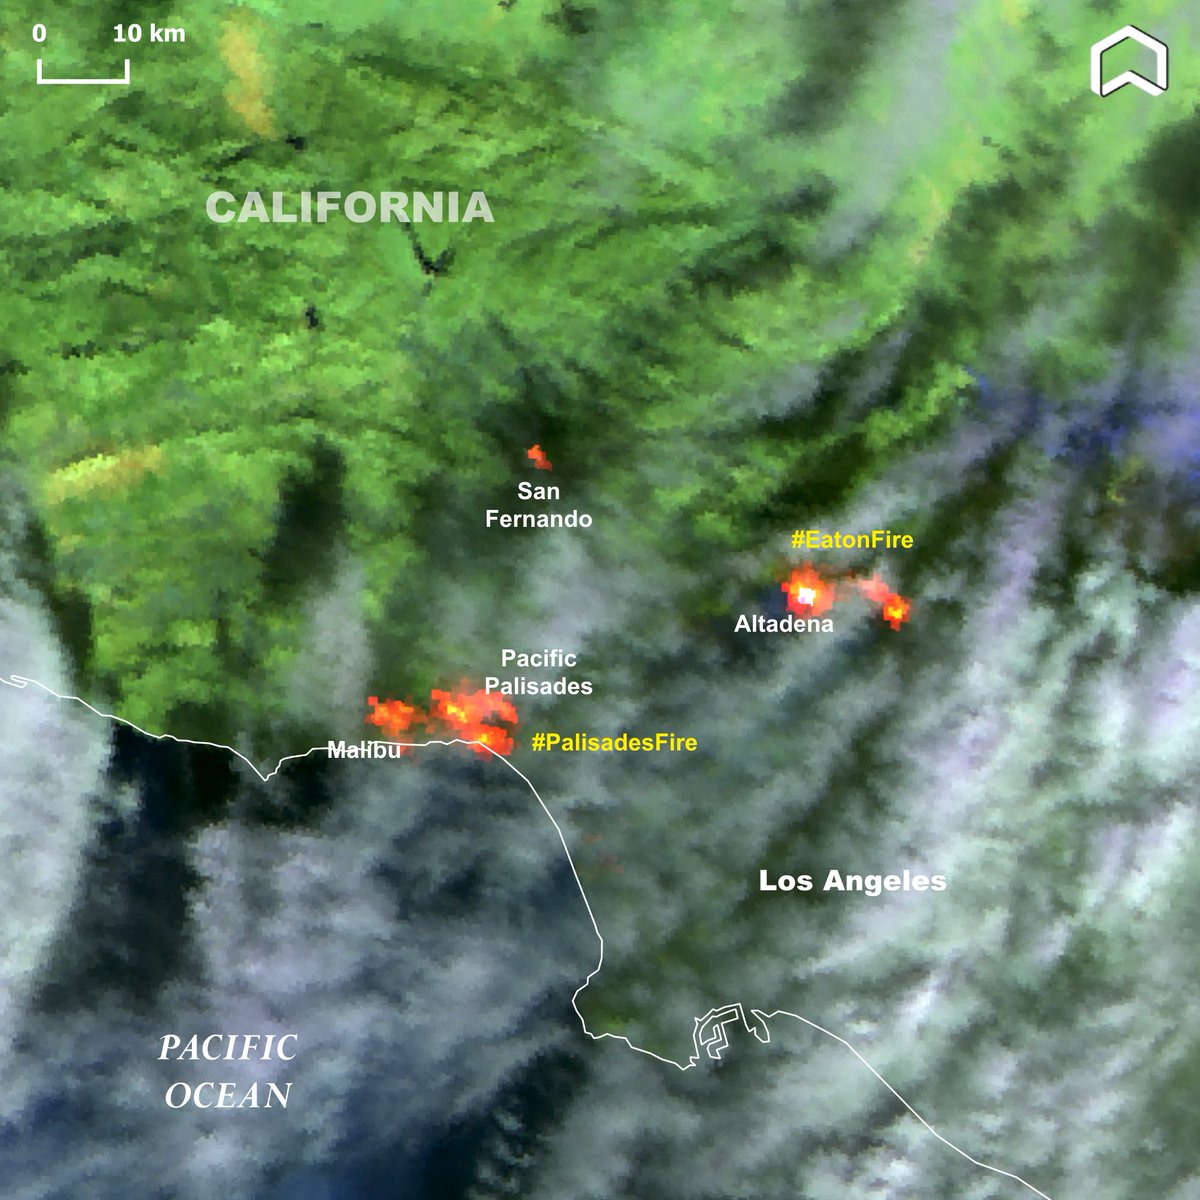
The last available #Copernicus #Sentinel3 image, collected on Jan. 8th shows the #LosAngelesFire. The destructive #CaliforniaWildfires keep burning across Southern California. The #PalisadesWildfire destroyed almost 1000 structures. #EatonFire #climateemergency #CAWildfire

The last available #Copernicus #Sentinel3 image, collected on Jan. 8th shows the #LosAngelesFire. 
The destructive #CaliforniaWildfires keep burning across Southern California. The #PalisadesWildfire destroyed almost 1000 structures. #EatonFire  #climateemergency #CAWildfire
Dr. Daniel Swain (@weather_west) 's Twitter Profile Photo

As enormous scope of the damage from #PalisadeFire & #EatonFire becomes clearer, I wanted to share this imagery depicting fire footprints (from 1/8) & potentially affected structures within them (provided by my colleague David Marvin @ Planet Labs). [Image below] #LAfires #CAfire

Copernicus ECMWF (@copernicusecmwf) 's Twitter Profile Photo

The Global Climate Highlights 2024 report is now online. Delve in the analysis and access all the charts, information, and data on temperature, sea ice, precipitation, and greenhouse gas concentrations. Explore the data that defined 2024: bit.ly/424M12O #C3S #GCH2024

The Global Climate Highlights 2024 report is now online. 
Delve in the analysis and access all the charts, information, and data on temperature, sea ice, precipitation, and greenhouse gas concentrations. Explore the data that defined 2024: bit.ly/424M12O
#C3S #GCH2024
EUMETSAT (@eumetsat) 's Twitter Profile Photo

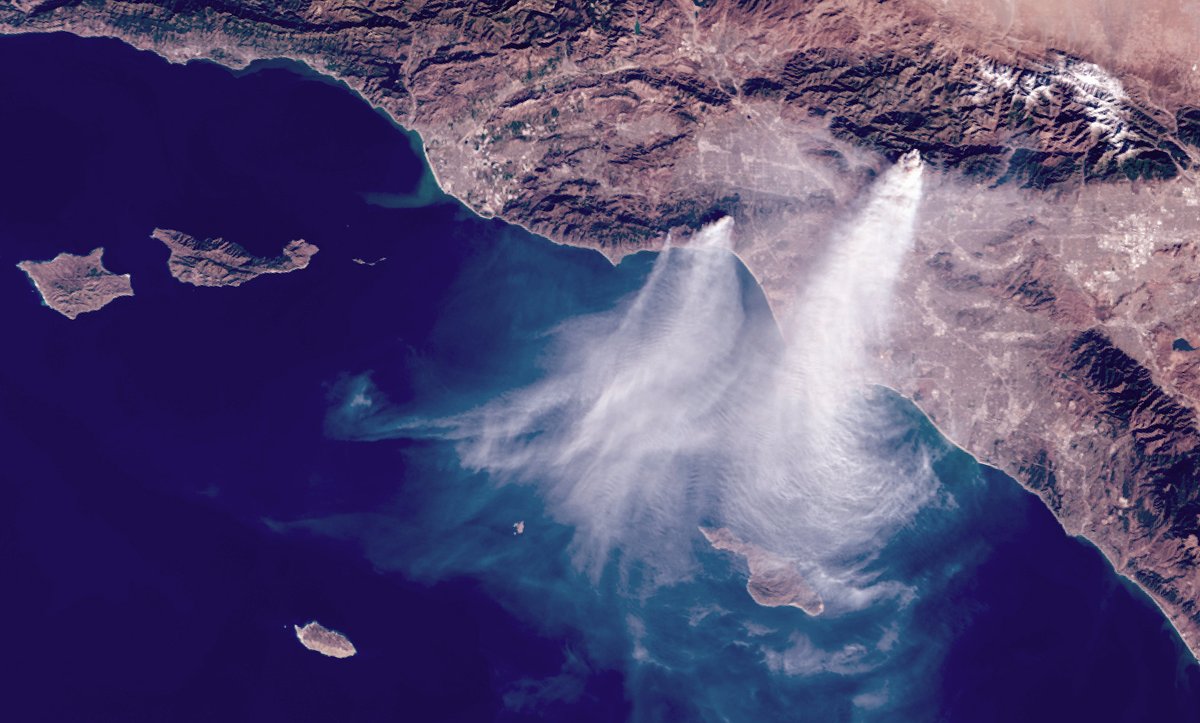
Devastating fires are currently impacting Los Angeles. We can monitor #wildfire activity from space. This image, captured by the #Copernicus #Sentinel3 satellite on 9 Jan 2025, shows the huge plumes of smoke. 🛰️🔥 View through WEkEO: bit.ly/3Pv0XiY #CaliforniaWildfires

Devastating fires are currently impacting Los Angeles.
We can monitor #wildfire activity from space. This image, captured by the #Copernicus #Sentinel3 satellite on 9 Jan 2025, shows the huge plumes of smoke. 🛰️🔥
View through WEkEO: bit.ly/3Pv0XiY
#CaliforniaWildfires
Copernicus ECMWF (@copernicusecmwf) 's Twitter Profile Photo

📈 In 2024, GHG reached their highest annual levels ever recorded in the atmosphere. 🌁 Carbon dioxide concentrations reached 422 ppm, 2.9 ppm higher than in 2023, & methane 1897 ppb, 3 ppb higher. ▶️ All details, charts and data in the #GCH2024 report: bit.ly/424M12O

📈 In 2024, GHG reached their highest annual levels ever recorded in the atmosphere. 
🌁 Carbon dioxide concentrations reached 422 ppm, 2.9 ppm higher than in 2023, &amp; methane 1897 ppb, 3 ppb higher.
▶️ All details, charts and data in the #GCH2024 report: bit.ly/424M12O
Copernicus ECMWF (@copernicusecmwf) 's Twitter Profile Photo

The amount of water in the atmosphere hit a record high in 2024 with 4.9% above the 1991–2020 average. This trend heightens the potential for extreme rainfall events. Explore the Global Climate Highlights 2024 report: bit.ly/424M12O #C3S #GCH2024

The amount of water in the atmosphere hit a record high in 2024 with 4.9% above the 1991–2020 average. This trend heightens the potential for extreme rainfall events. Explore the Global Climate Highlights 2024 report: bit.ly/424M12O 

#C3S #GCH2024
EUMETSAT (@eumetsat) 's Twitter Profile Photo

This image of the week shows smoke plumes from the devastating #wildfires that are impacting Los Angeles. Find out more about the image, captured by Copernicus EU #Sentinel3, at: eumetsat.int/image-week-los… #LAFires #PalisadesFire
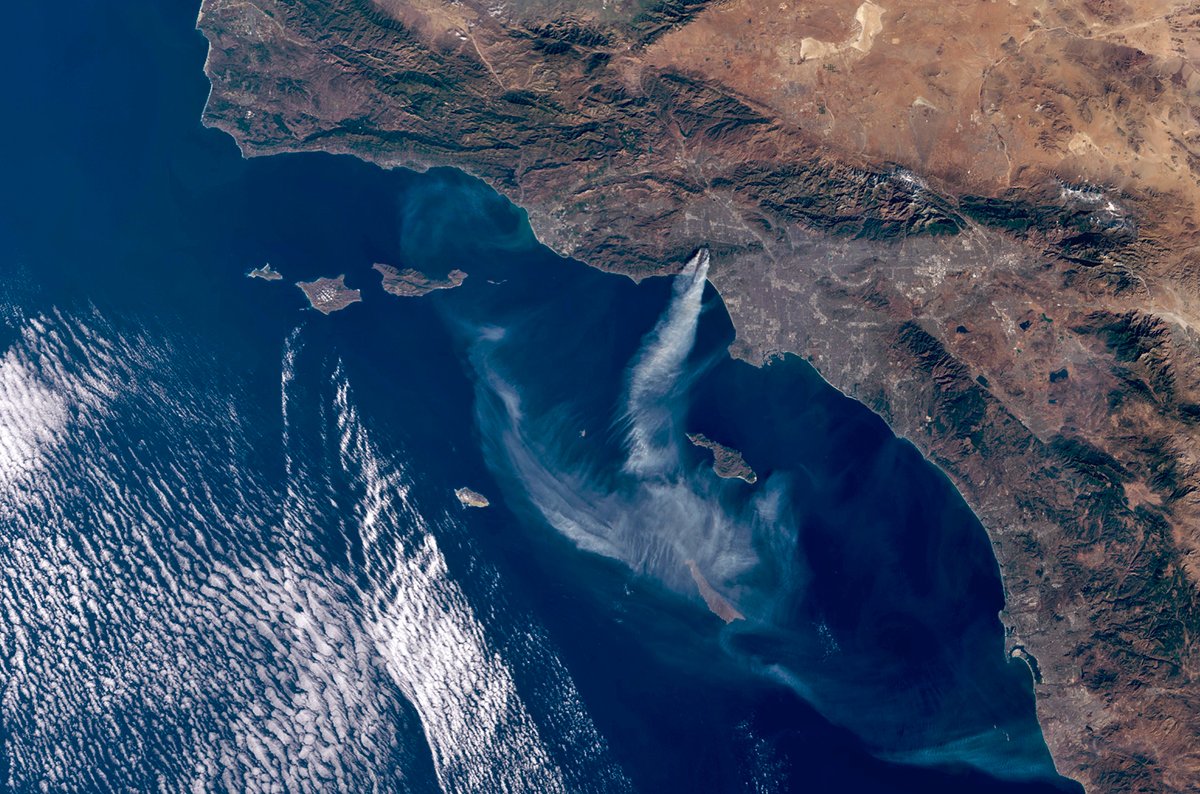
This image of the week shows smoke plumes from the devastating #wildfires that are impacting Los Angeles.

Find out more about the image, captured by <a href="/CopernicusEU/">Copernicus EU</a> #Sentinel3, at: eumetsat.int/image-week-los…

#LAFires #PalisadesFire
Copernicus EMS (@copernicusems) 's Twitter Profile Photo

👀🔥Check out the evolution of the #California wildfires, captured by the Global Wildfire Information System #GWIS🛰️ The maps show in red the burnt areas from 7 to 14 January 2025. 👉gwis.jrc.ec.europa.eu/apps/gwis_curr…

AerosolWatch (@aerosolwatch) 's Twitter Profile Photo

Sentinel-5P TROPOMI observed build-up of tropospheric nitrogen dioxide (NO2) across North America yesterday 14 Jan, particularly emissions from urban areas of the continental US. Gaps in NO2 measurements are due to cloud cover. Copernicus EMS Dan Goldberg, PhD Aaron Naeger
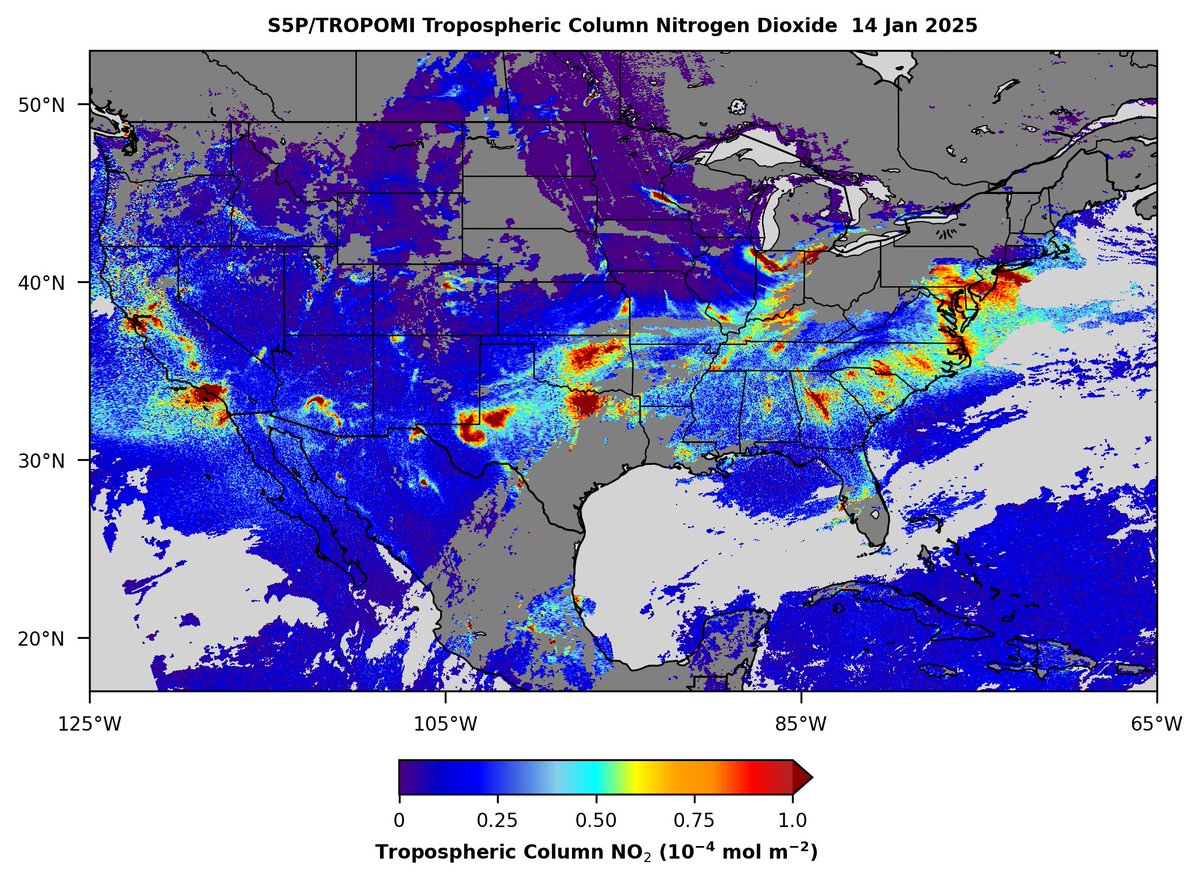
Sentinel-5P <a href="/tropomi/">TROPOMI</a> observed build-up of tropospheric nitrogen dioxide (NO2) across North America yesterday 14 Jan, particularly emissions from urban areas of the continental US. Gaps in NO2 measurements are due to cloud cover.  <a href="/CopernicusEMS/">Copernicus EMS</a> <a href="/DGoldbergAQ/">Dan Goldberg, PhD</a> <a href="/NaegerAaron/">Aaron Naeger</a>
AerosolWatch (@aerosolwatch) 's Twitter Profile Photo

Seasonal biomass burning in central Africa is releasing large amounts of carbon monoxide (CO) into the atmosphere (teal/yellow/orange/red shading), as observed by Sentinel- 5P TROPOMI on 15 Jan. Copernicus EMS Mark Parrington
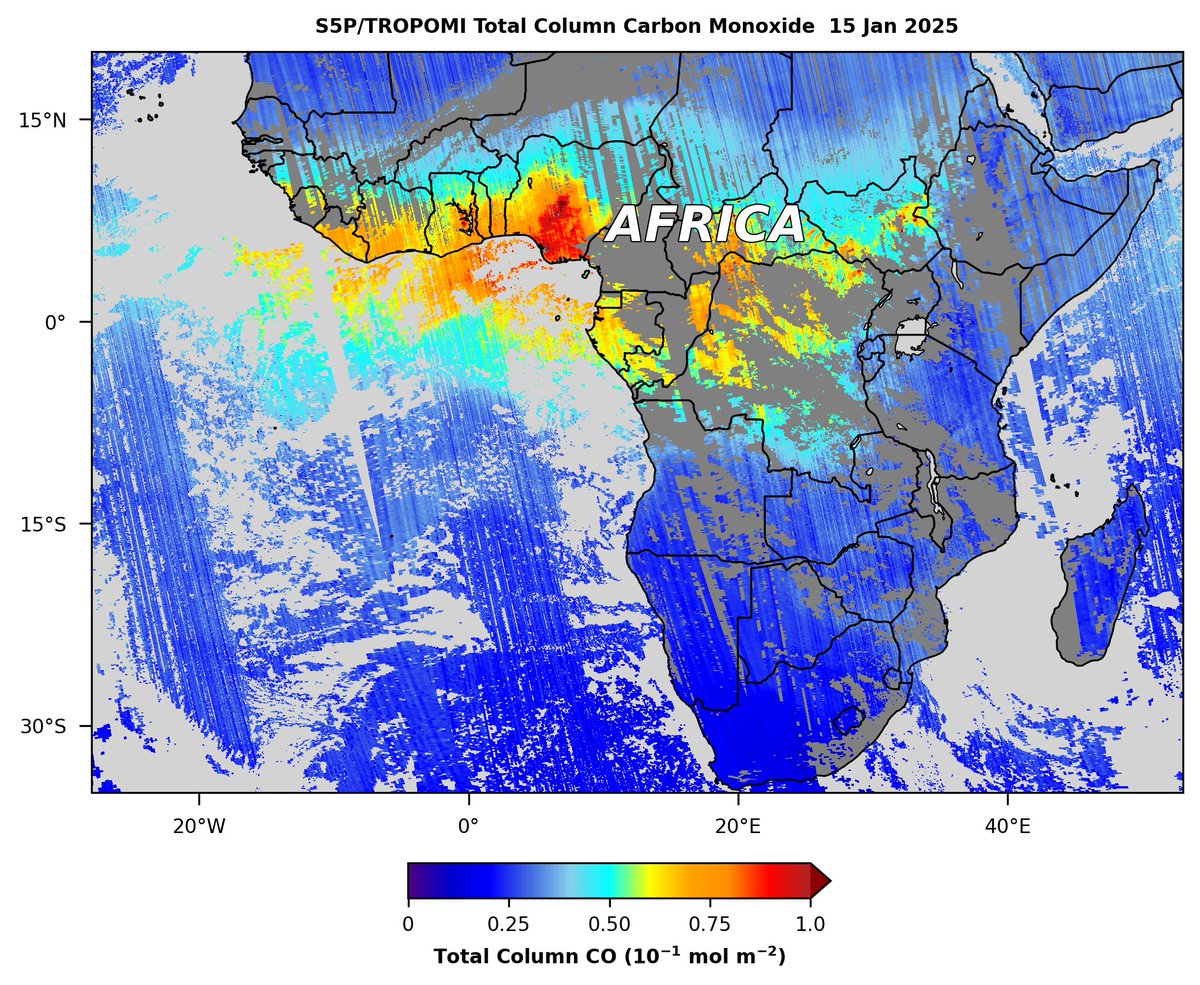
Seasonal biomass burning in central Africa is releasing large amounts of carbon monoxide (CO) into the atmosphere (teal/yellow/orange/red shading), as observed by Sentinel- 5P <a href="/tropomi/">TROPOMI</a> on 15 Jan.  <a href="/CopernicusEMS/">Copernicus EMS</a> <a href="/m_parrington/">Mark Parrington</a>
Copernicus ECMWF (@copernicusecmwf) 's Twitter Profile Photo

We have updated our wildfire summary for 2024 with the latest #CopernicusAtmosphere data from Dec. Last year, North and South America saw the most wildfire activity. Dive into the analysis and data: atmosphere.copernicus.eu/cams-global-wi… Copernicus EU ECMWF @RichardJEngelen Mark Parrington

Copernicus ECMWF (@copernicusecmwf) 's Twitter Profile Photo

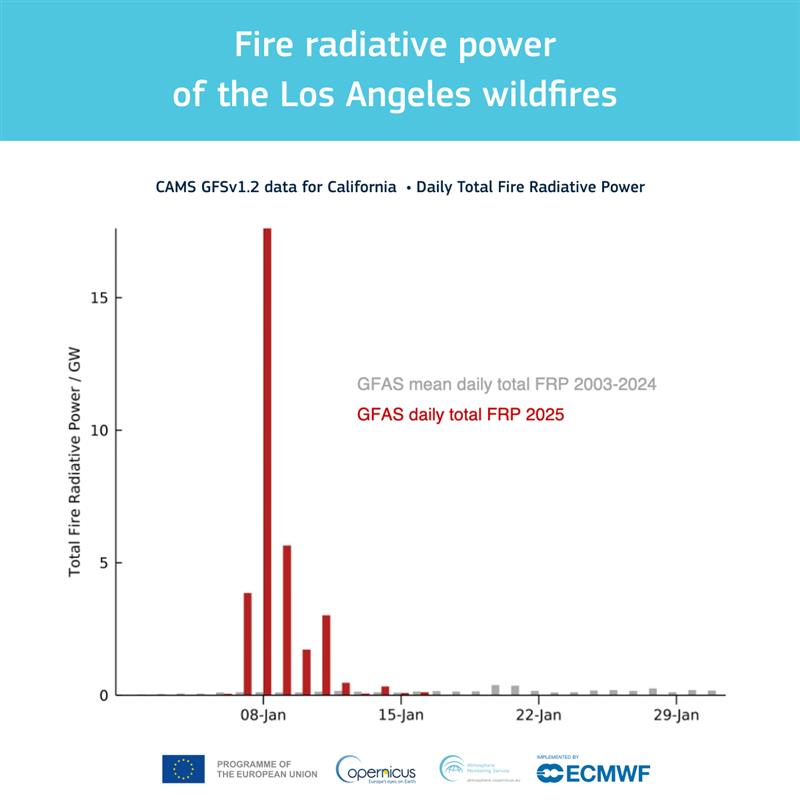
#CopernicusAtmosphere data indicate the increased intensity, emissions and potential #airquality impacts of the Los Angeles wildfires. Learn more about the findings and how CAMS monitors global fire emissions 🔥 bit.ly/4hkiTsI

#CopernicusAtmosphere data indicate the increased intensity, emissions and potential #airquality impacts of the Los Angeles wildfires. Learn more about the findings and how CAMS monitors global fire emissions 🔥 bit.ly/4hkiTsI