Martha Gimbel (@marthagimbel) 's Twitter Profile
Martha Gimbel

@marthagimbel

Executive director @the_budget_lab, former @whitehousecea, @indeed, @jecdems, @USDOL, among others. Personal opinions.

ID: 4834184626

calendar_today22-01-2016 04:02:55

12,12K Tweet

13,13K Followers

1,1K Following

Jed Kolko (@jedkolko) 's Twitter Profile Photo

Q2 GDP report: Final sales to private domestic purchasers falls further. Q2: 1.2% Q1: 1.9% Q4 2024: 2.9% This measure excludes exports, imports, inventories, and govt. Kind of a "core" GDP.

Jason Furman (@jasonfurman) 's Twitter Profile Photo

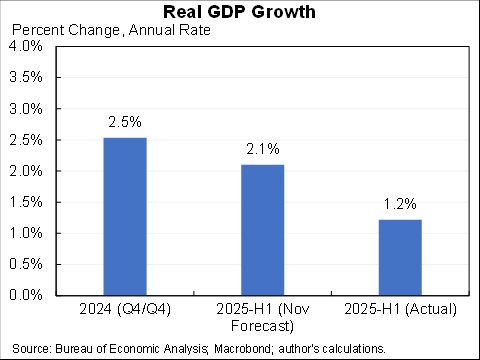
Q2 GDP came in at a 3.0% annual rate. There were massive timing shifts that shifted reported growth from Q1 to Q2. The much better way to look at the data is averaging the two which is a 1.2% annual rate. That is well below the pace in 2024 or the Nov 2024 forecast for 2025-H1.

Q2 GDP came in at a 3.0% annual rate.

There were massive timing shifts that shifted reported growth from Q1 to Q2. The much better way to look at the data is averaging the two which is a 1.2% annual rate. That is well below the pace in 2024 or the Nov 2024 forecast for 2025-H1.
Jason Furman (@jasonfurman) 's Twitter Profile Photo

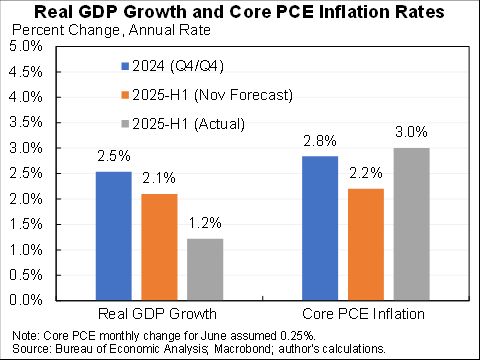
Finally, I don't think people appreciate just how much re-inflation we've had. Last year core PCE inflation was 2.8%. It was forecasted to fall to 2.2% in the first half of this year, instead it was 3.0% (annual rate).

Finally, I don't think people appreciate just how much re-inflation we've had. Last year core PCE inflation was 2.8%. It was forecasted to fall to 2.2% in the first half of this year, instead it was 3.0% (annual rate).
Jason Furman (@jasonfurman) 's Twitter Profile Photo

In sum, in the first half of this year GDP was relatively weak (1.2%) and core inflation was relatively high (3.0%). This is not a catastrophic recession or inflation but it is a cause for serious concern--and a real quandary for the Fed.

In sum, in the first half of this year GDP was relatively weak (1.2%) and core inflation was relatively high (3.0%). This is not a catastrophic recession or inflation but it is a cause for serious concern--and a real quandary for the Fed.
Ricco (@riccoja) 's Twitter Profile Photo

Quick new The Budget Lab post breaking down the distribution of the size of income tax cuts under the new tax law *above and beyond extension of existing 2025 law*. From this perspective, close to half of households will see a tax cut of less than $100.

Quick new <a href="/The_Budget_Lab/">The Budget Lab</a> post breaking down the distribution of the size of income tax cuts under the new tax law *above and beyond extension of existing 2025 law*. From this perspective, close to half of households will see a tax cut of less than $100.
Ernie Tedeschi (@ernietedeschi) 's Twitter Profile Photo

New The Budget Lab tariff analysis incorporating the 25% tariff on India, up from our previously-assumed 10% and which goes into effect August 1. In brief... 1/10

New <a href="/The_Budget_Lab/">The Budget Lab</a> tariff analysis incorporating the 25% tariff on India, up from our previously-assumed 10% and which goes into effect August 1. In brief... 
1/10
Ernie Tedeschi (@ernietedeschi) 's Twitter Profile Photo

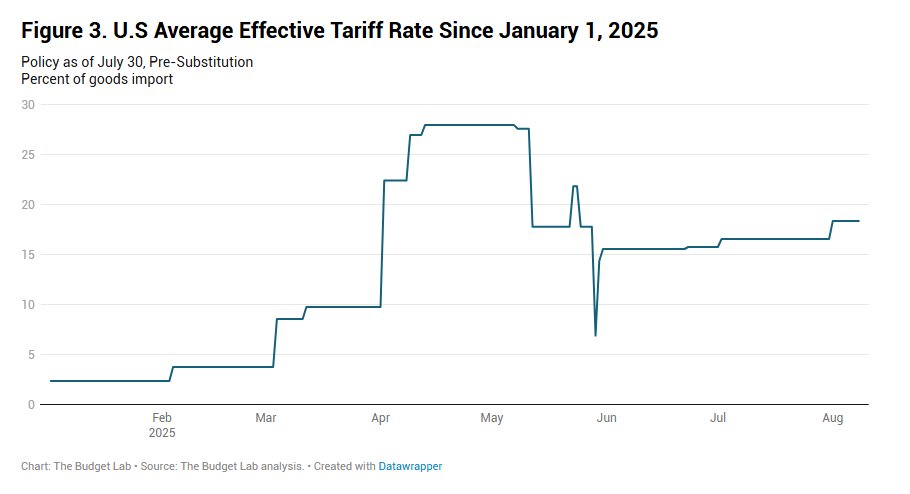
The Budget Lab Consumers face an overall average effective tariff rate of 18.4%, a 16pp increase from 2024 & the highest since 1933. After consumers & businesses shift spending in reaction to the tariffs, the average tariff rate will be 17.5%, a 15.1pp increase & the highest since 1934. 2/10
<a href="/The_Budget_Lab/">The Budget Lab</a> Consumers face an overall average effective tariff rate of 18.4%, a 16pp increase from 2024 &amp; the highest since 1933. After consumers &amp; businesses shift spending in reaction to the tariffs, the average tariff rate will be 17.5%, a 15.1pp increase &amp; the highest since 1934.
2/10
Jed Kolko (@jedkolko) 's Twitter Profile Photo

As US population growth slows, we need to reset expectations for economic data. Payrolls, GDP, expenditures, and income will all grow more slowly now that the immigration surge has ended. That changes how we interpret ... everything. My first piece for Peterson Institute (link follows)

Ernie Tedeschi (@ernietedeschi) 's Twitter Profile Photo

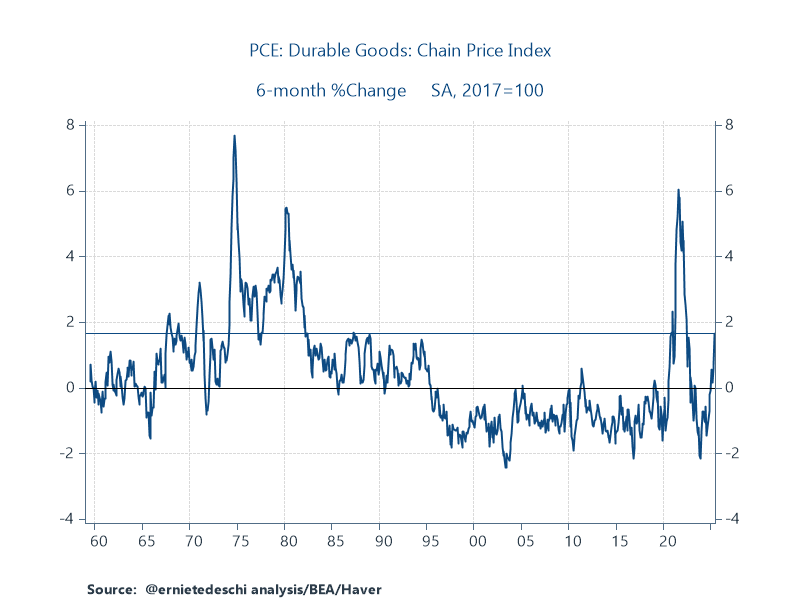
Core PCE inflation comes in 0.26% MM (3.1% annualized) in June, 2.8% YY. Durable goods have risen in price by 1.7% so far year to date. Other than the depths of the pandemic, that's the strongest 6-month rise in PCE durables prices since 1987.

Core PCE inflation comes in 0.26% MM (3.1% annualized) in June, 2.8% YY. 

Durable goods have risen in price by 1.7% so far year to date. Other than the depths of the pandemic, that's the strongest 6-month rise in PCE durables prices since 1987.
Martha Gimbel (@marthagimbel) 's Twitter Profile Photo

It is once again the case that when you score the OBBBA dynamically it is actually MORE expensive than a conventional score.