Pamela Schultz, PhD (@pamsdata) 's Twitter Profile
Pamela Schultz, PhD

@pamsdata

ID: 1158324625

calendar_today07-02-2013 21:28:03

183 Tweet

64 Followers

101 Following

Pamela Schultz, PhD (@pamsdata) 's Twitter Profile Photo

Join meย at theย annual Women in Data Science (WiDS) Virtual Conference broadcasting on September 14th! Watch the free online broadcast on the WiDS YouTube Channel:ย bit.ly/WiDSYouTube.

Pamela Schultz, PhD (@pamsdata) 's Twitter Profile Photo

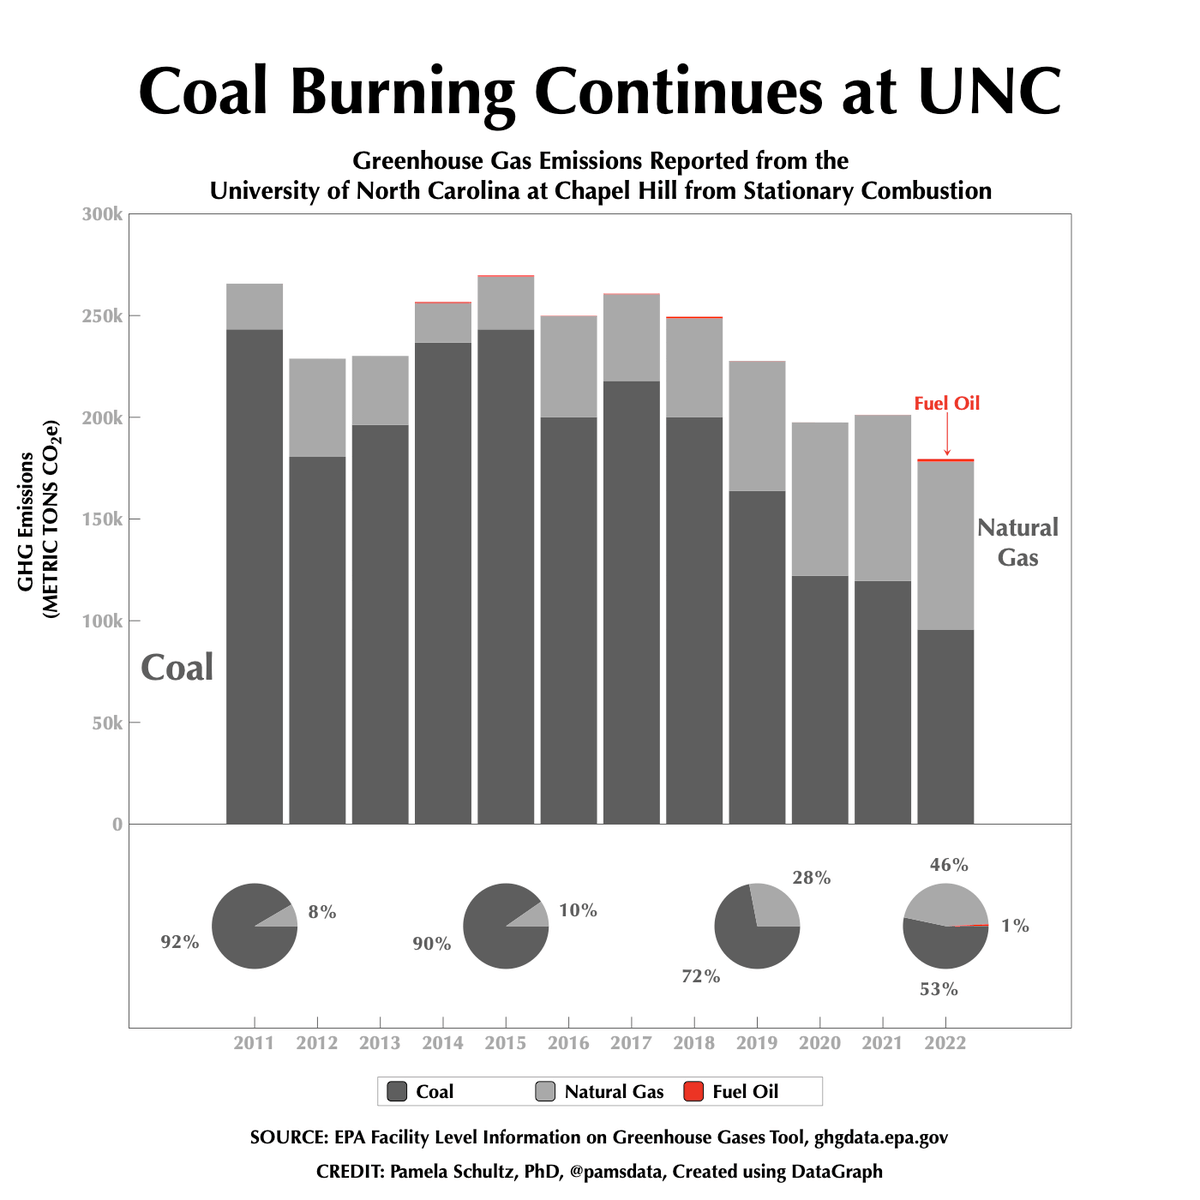
#30DayChartChallenge Day 1 | Part-to-Whole I pulled GHG emissions from the U.S. EPA for UNC, which pledged to stop burning coal in 2020. Switching to natural gas decreased total emissions, but coal remains the top contributor. Data: ghgdata.epa.gov Tool: DataGraph

#30DayChartChallenge  Day 1 | Part-to-Whole
I pulled GHG emissions from the <a href="/EPA/">U.S. EPA</a> for UNC, which pledged to stop burning coal in 2020.  Switching to natural gas decreased total emissions, but coal remains the top contributor.
Data: ghgdata.epa.gov Tool: <a href="/datagraphapp/">DataGraph</a>
Pamela Schultz, PhD (@pamsdata) 's Twitter Profile Photo

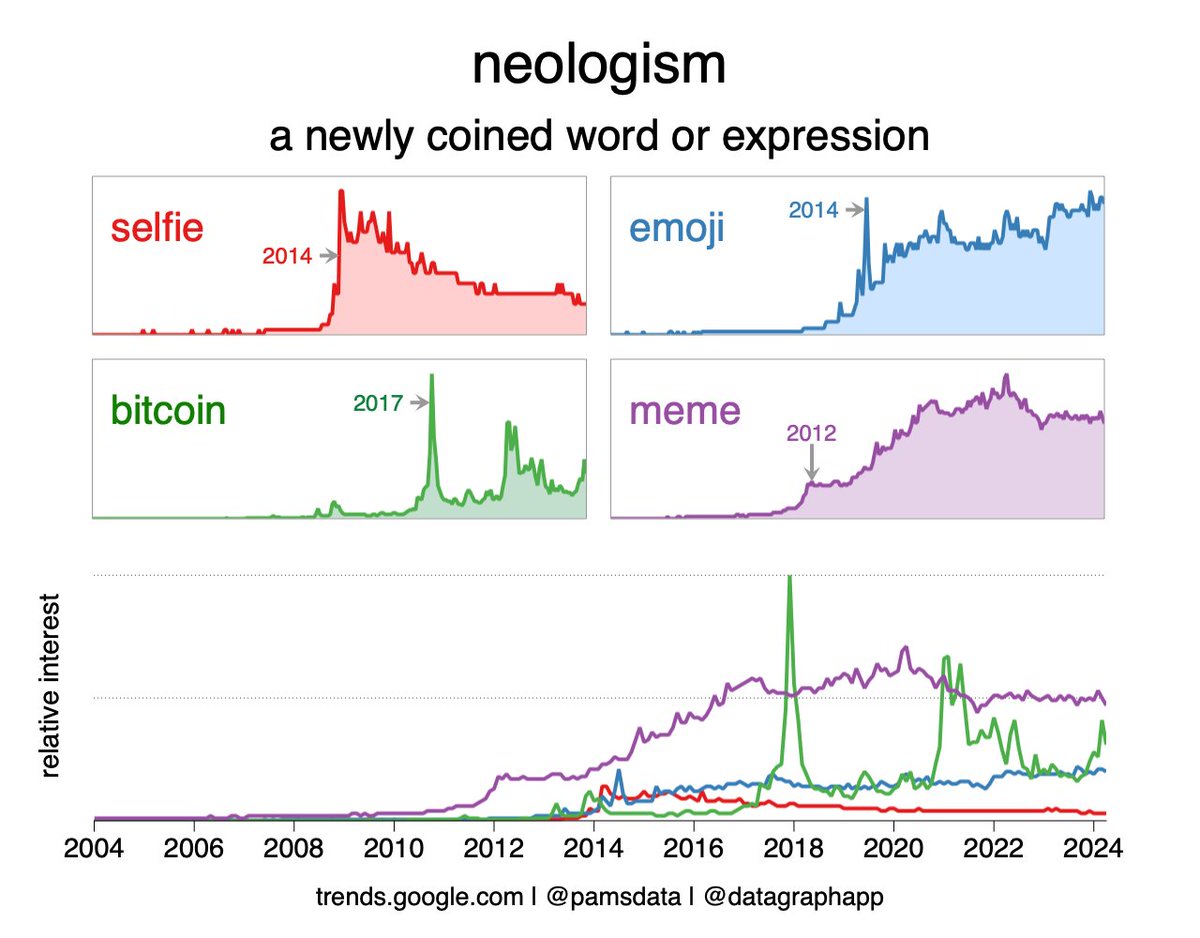
#30DayChartChallenge | Day 2 | Neo Went with new words for this one.๐Ÿ“ˆ 'Meme' and 'Emoji' are still going strong according to #google #trends.๐Ÿง Tool: DataGraph Data: trends.google.com/trends/exploreโ€ฆ

#30DayChartChallenge | Day 2 | Neo

Went with new words for this one.๐Ÿ“ˆ 'Meme' and 'Emoji' are still going strong according to #google #trends.๐Ÿง

Tool: <a href="/datagraphapp/">DataGraph</a> 
Data: trends.google.com/trends/exploreโ€ฆ
Pamela Schultz, PhD (@pamsdata) 's Twitter Profile Photo

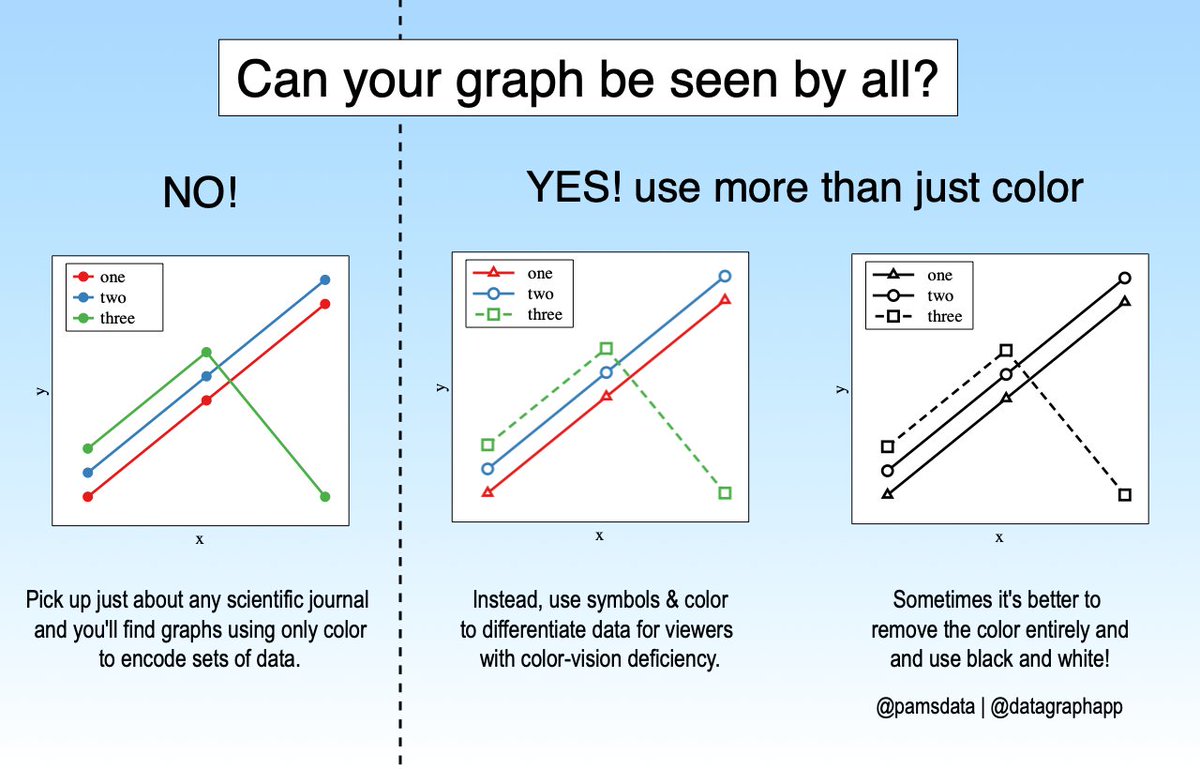
#30DayChartChallenge Day 3 | Makeover For today, I made up data, but the graph is almost identical to one published in a recent scientific journal. In fact, I see graphs published ALL THE TIME that use ONLY color to encode data. color-blindness.com Tool: DataGraph

#30DayChartChallenge
Day 3 | Makeover

For today, I made up data, but the graph is almost  identical to one published in a recent scientific journal. In fact, I see graphs published ALL THE TIME that use ONLY color to encode data.

color-blindness.com

Tool: <a href="/datagraphapp/">DataGraph</a>
Pamela Schultz, PhD (@pamsdata) 's Twitter Profile Photo

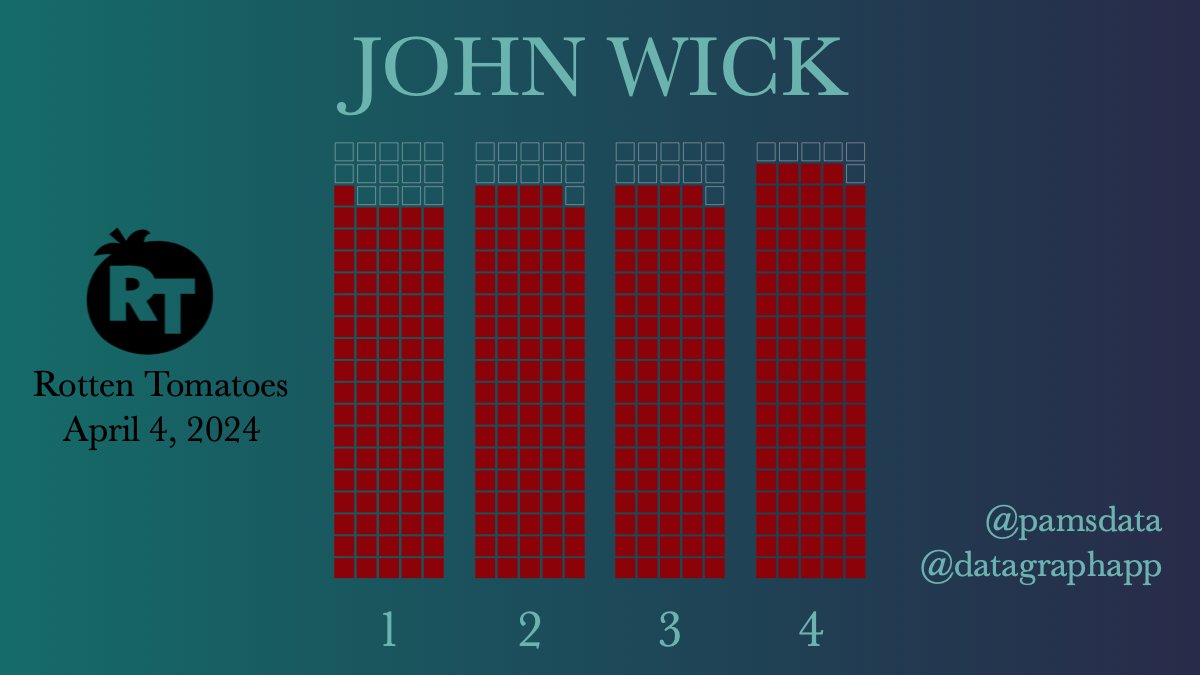
#30DayChartChallenge Day 4 | Waffle #JohnWick 4 was released just over a year ago and has the highest #RottenTomatoes ranking of the entire franchise, at 94%! Yes, I am a fan. Data: rottentomatoes.com/search?search=โ€ฆ Tool: DataGraph

#30DayChartChallenge 
Day 4 | Waffle

#JohnWick 4 was released just over a year ago and has the highest #RottenTomatoes ranking of the entire franchise, at 94%! Yes, I am a fan.

Data: rottentomatoes.com/search?search=โ€ฆ
Tool: <a href="/datagraphapp/">DataGraph</a>
Pamela Schultz, PhD (@pamsdata) 's Twitter Profile Photo

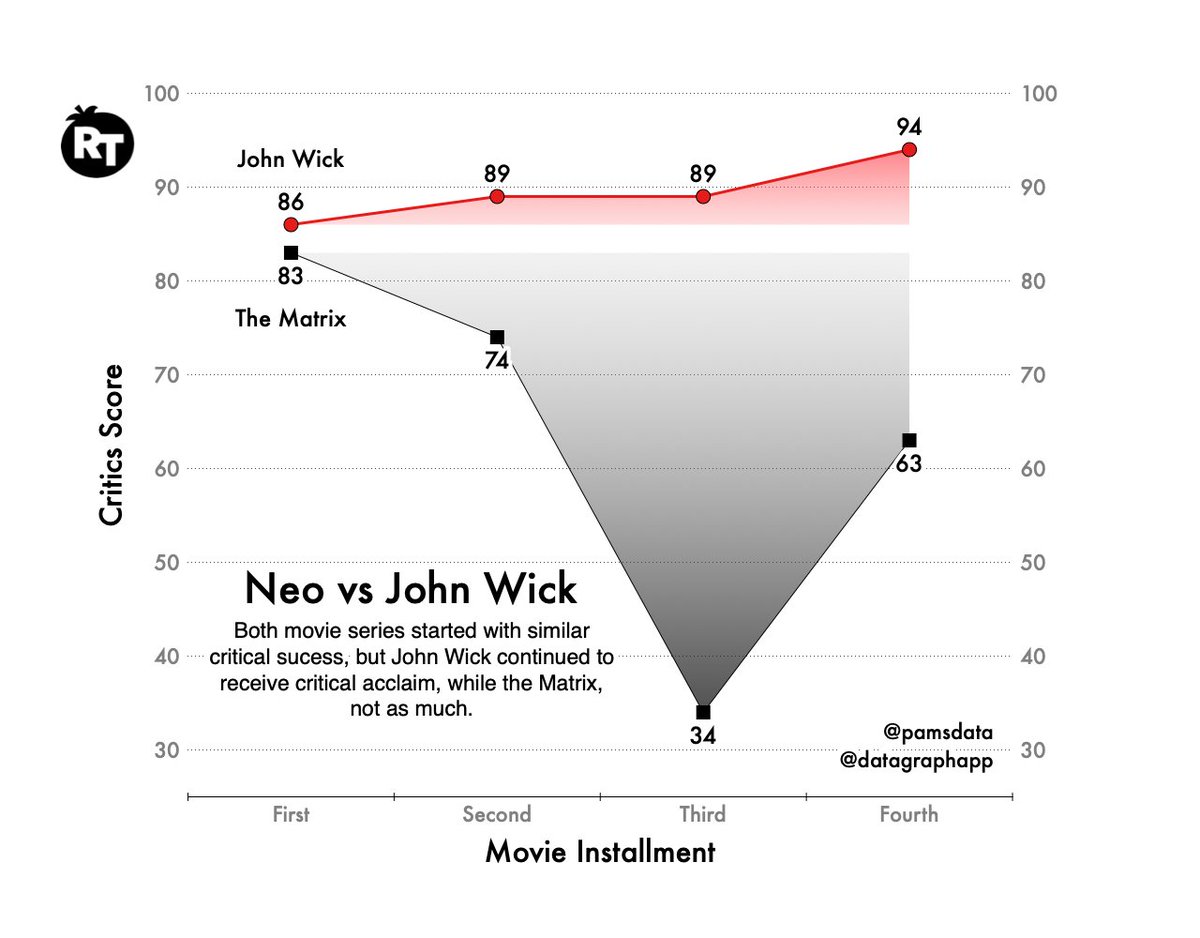
#30DayChartChallenge Day 5 | diverging Went to the movies again for this one. ๐Ÿ“ฝ๏ธ (second time posting - I forgot to add the image the first time ๐Ÿคช) Tool: DataGraph Data: #rottentomatoes

#30DayChartChallenge 
Day 5 | diverging

Went to the movies again for this one.
๐Ÿ“ฝ๏ธ (second time posting - I forgot to add the image the first time ๐Ÿคช)

Tool: <a href="/datagraphapp/">DataGraph</a>
Data: #rottentomatoes
Pamela Schultz, PhD (@pamsdata) 's Twitter Profile Photo

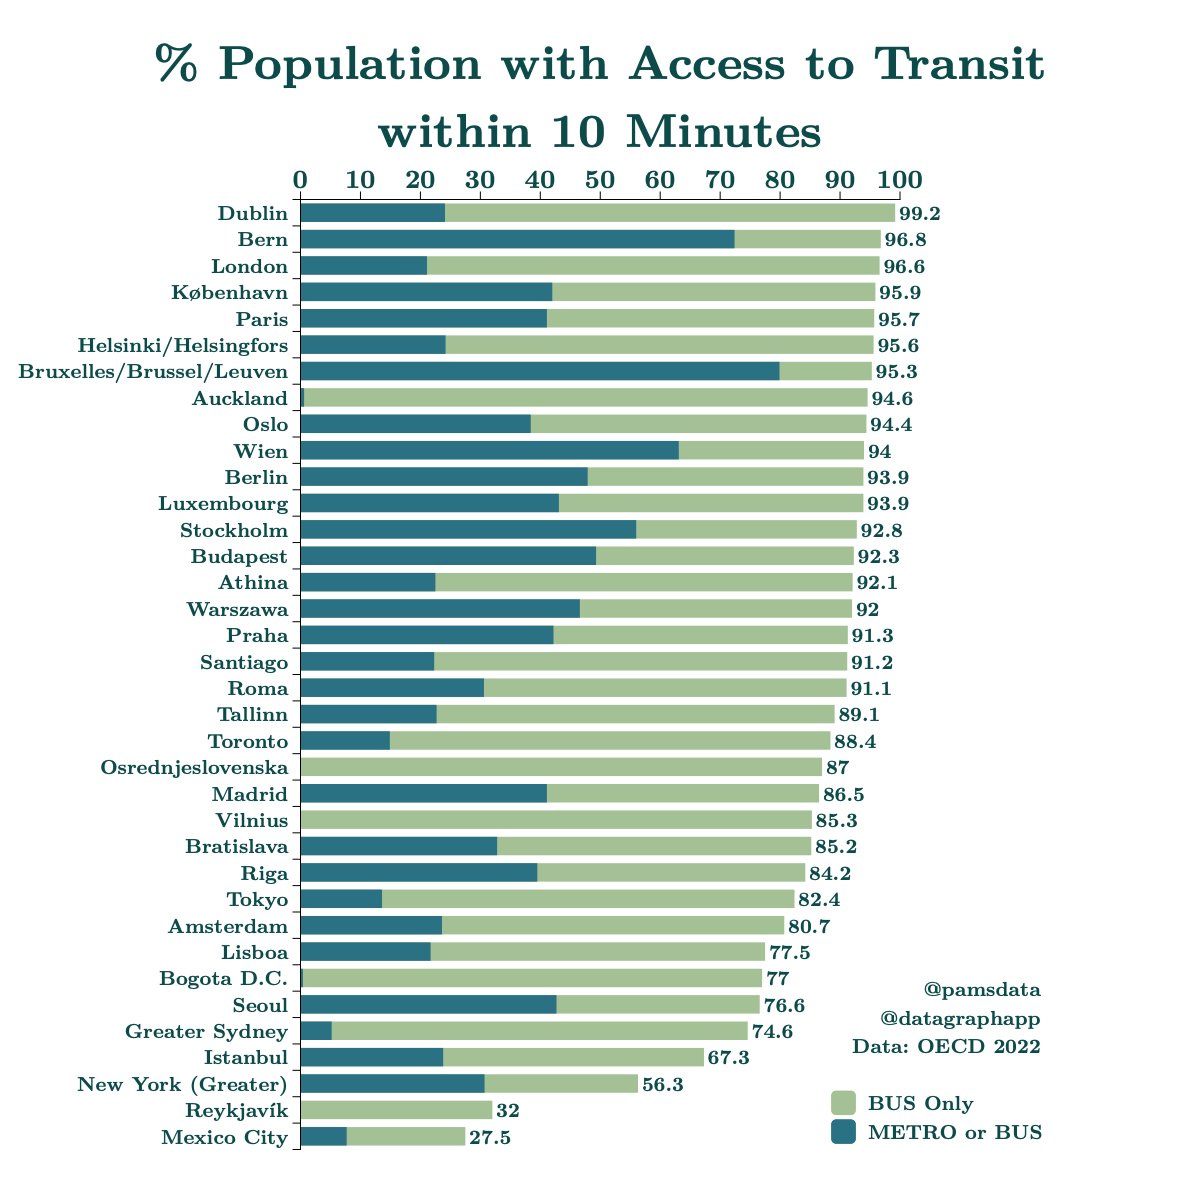
#30DayChartChallenge Day 6 | OECD โžก๏ธ Better Policies for Better Lives Picked data to access transit. Dublin topped the list with nearly 100% of the population within 10 minutes of transit! ๐Ÿš๐Ÿš† Tool: DataGraph Data: OECD โžก๏ธ Better Policies for Better Lives Access to public transport
#30DayChartChallenge
Day 6 | <a href="/OECD/">OECD โžก๏ธ Better Policies for Better Lives</a> 

Picked data to access transit. Dublin topped the list with nearly 100% of the population within 10 minutes of transit! ๐Ÿš๐Ÿš†

Tool: <a href="/datagraphapp/">DataGraph</a> 
Data: <a href="/OECD/">OECD โžก๏ธ Better Policies for Better Lives</a> Access to public transport
Pamela Schultz, PhD (@pamsdata) 's Twitter Profile Photo

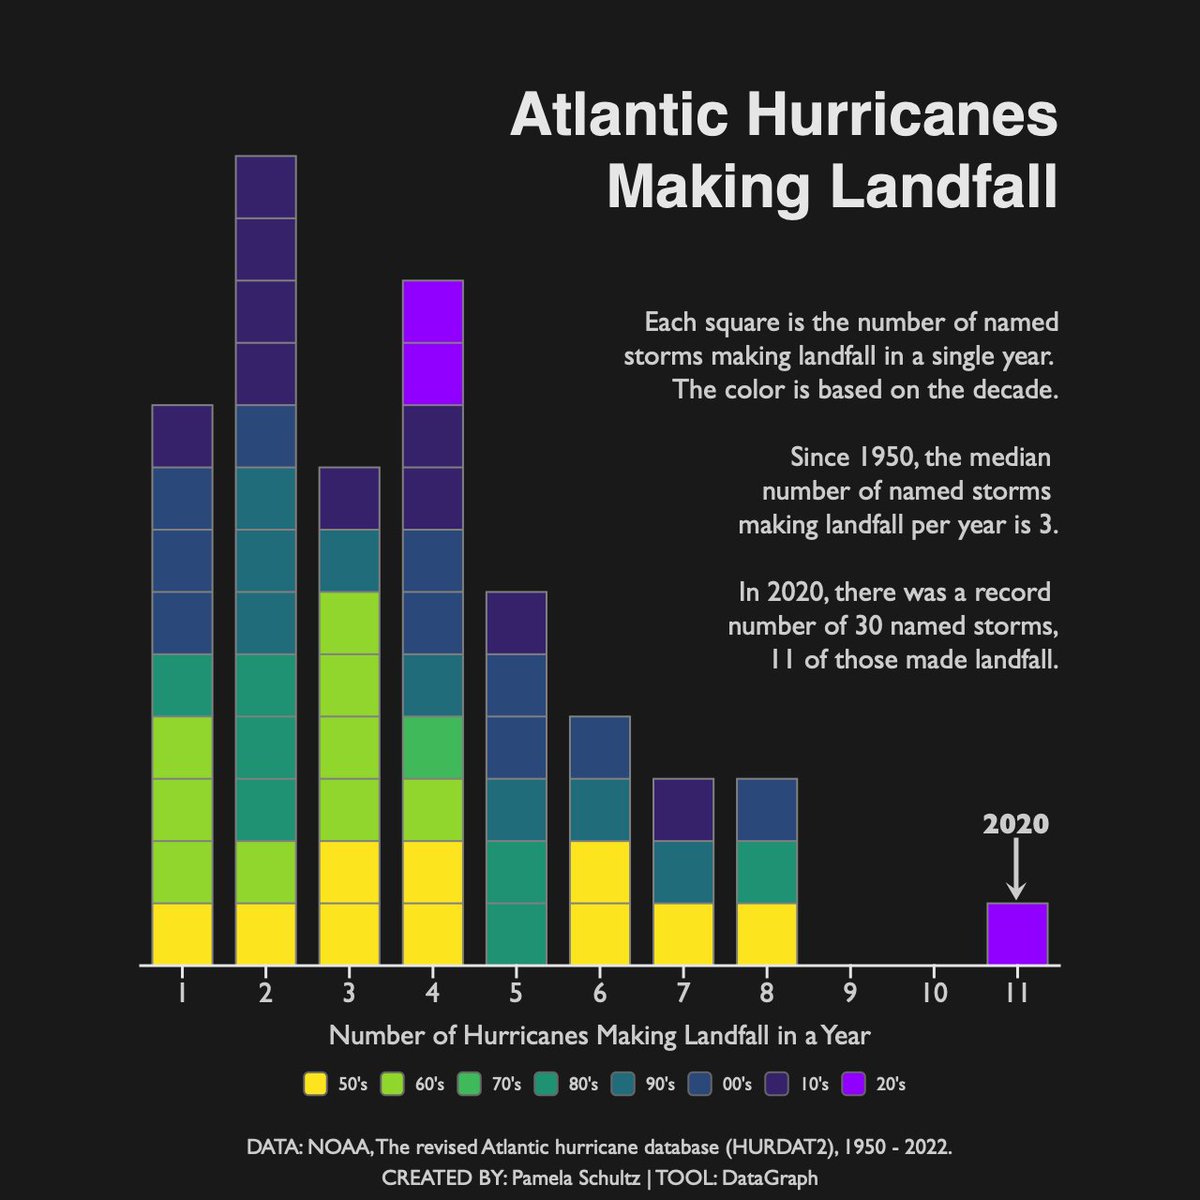
#30DayChartChallenge Day 7 | Distributions | Hazards North Carolina, where I live, is known for its hurricanes. So for this prompt, I downloaded the HURDAT database and counted named storms that made landfall in the US from 1950 to 2022. Data: NOAA Tool: DataGraph

#30DayChartChallenge 
Day 7 | Distributions | Hazards

North Carolina, where I live, is known for its hurricanes. So for this prompt, I downloaded the HURDAT database and counted named storms that made landfall in the US from 1950 to 2022. 

Data: <a href="/NOAA/">NOAA</a> 
Tool: <a href="/datagraphapp/">DataGraph</a>
Pamela Schultz, PhD (@pamsdata) 's Twitter Profile Photo

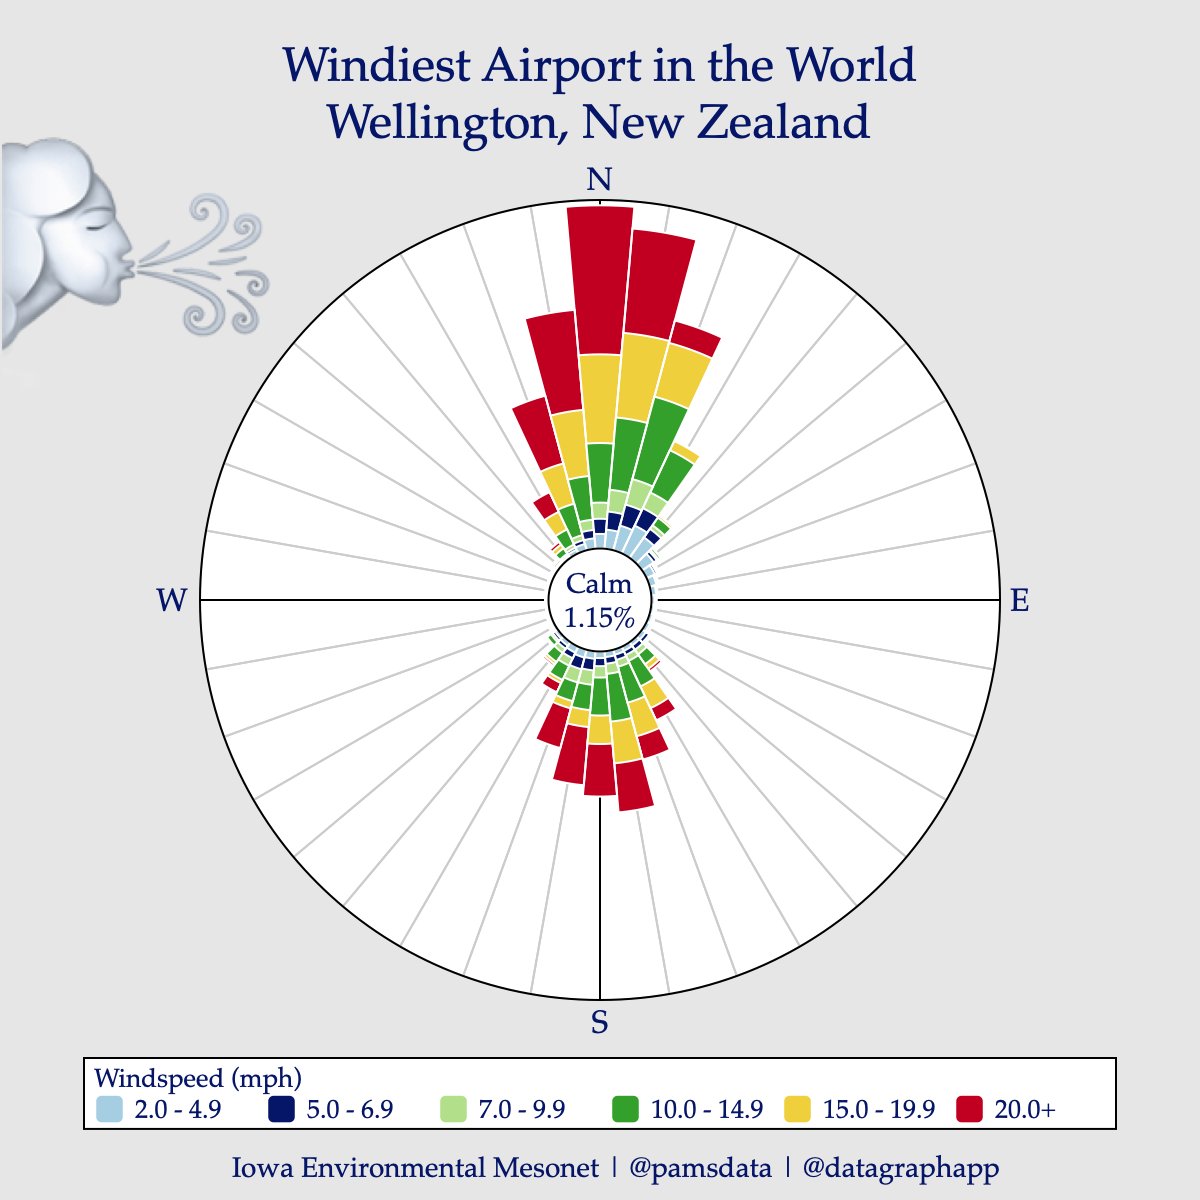
#30DayChartChallenge Day 8 | distributions | circular For today, I used data from Wellington, New Zealand, the so-called windiest airport in the world, to create a Wind Rose, showing the wind speed and direction. ๐ŸŒฌ๏ธโœˆ๏ธ Tool: DataGraph Data: climate.gov/maps-data/dataโ€ฆ

#30DayChartChallenge 
Day 8 | distributions | circular

For today, I used data from Wellington, New Zealand, the so-called windiest airport in the world, to create a Wind Rose, showing the wind speed and direction. 
๐ŸŒฌ๏ธโœˆ๏ธ

Tool: <a href="/datagraphapp/">DataGraph</a>
Data: climate.gov/maps-data/dataโ€ฆ
Pamela Schultz, PhD (@pamsdata) 's Twitter Profile Photo

#30DayChartChallenge Day 9 | Distributions | Major Minor This was fun ๐ŸŽผ Ranked major and minor keys used in popular songs according to Hooktheory. Here are two examples from the #Beatles C Major - Let It Be A Minor - You Never Give Me Your Money tool: DataGraph

#30DayChartChallenge
Day 9 | Distributions | Major Minor

This was fun ๐ŸŽผ Ranked major and minor keys used in popular songs according to <a href="/hooktheory/">Hooktheory</a>.

Here are two examples from the #Beatles 
C Major - Let It Be 
A Minor - You Never Give Me Your Money

tool: <a href="/datagraphapp/">DataGraph</a>
Pamela Schultz, PhD (@pamsdata) 's Twitter Profile Photo

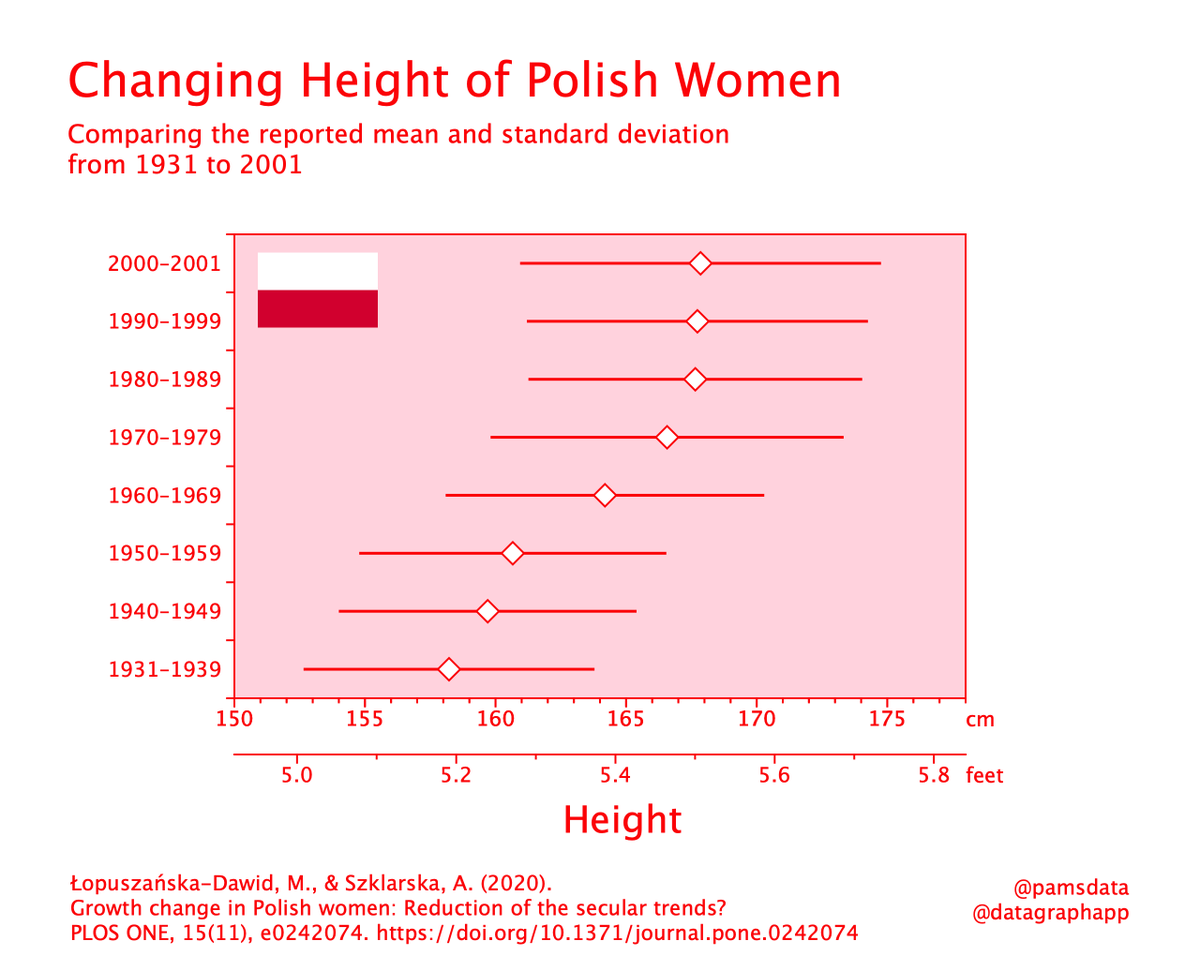
#30daychartchallenge Day 10 | Distributions | Physical I decided to do something with height and stumbled upon this article on the height of Polish women. I had no idea height could change that much over time. journals.plos.org/plosone/articlโ€ฆ Tool: DataGraph

#30daychartchallenge
Day 10 | Distributions | Physical

I decided to do something with height and stumbled upon this article on the height of Polish women. I had no idea height could change that much over time.
journals.plos.org/plosone/articlโ€ฆ

Tool: <a href="/datagraphapp/">DataGraph</a>