Marco Sciaini (@shinysci) 's Twitter Profile
Marco Sciaini

@shinysci

🗺️ | 📈 | 🔍 | 🐶 | 🛰️ | 🍜 | ☕ | Freelance Developer and Analyst

ID: 1307060010669793280

linkhttp://marcosci.github.io calendar_today18-09-2020 20:53:04

721 Tweet

959 Followers

953 Following

Marco Sciaini (@shinysci) 's Twitter Profile Photo

Happy that our project climate-conflict.org is finally revealed during the #BCSC - impressive visual work by Moritz Stefaner and @[email protected]! Go over there and explore the relationship between #climatechange and violent conflicts. #svelte #gischat

Happy that our project climate-conflict.org  is finally revealed during the #BCSC - impressive visual work by  <a href="/moritz_stefaner/">Moritz Stefaner</a> and <a href="/flaviogortana/">@flavio@vis.social</a>! 

Go over there and explore the relationship between #climatechange and violent conflicts.

#svelte #gischat
Marco Sciaini (@shinysci) 's Twitter Profile Photo

#30DayMapChallenge | Day 1 | #points Recreating a visualisation by Moritz Stefaner he did for climate-conflict.org with #rstats #rspatial. #dataviz #gischat

#30DayMapChallenge | Day 1 | #points 

Recreating a visualisation by <a href="/moritz_stefaner/">Moritz Stefaner</a> he did for climate-conflict.org with #rstats #rspatial. 

#dataviz #gischat
Marco Sciaini (@shinysci) 's Twitter Profile Photo

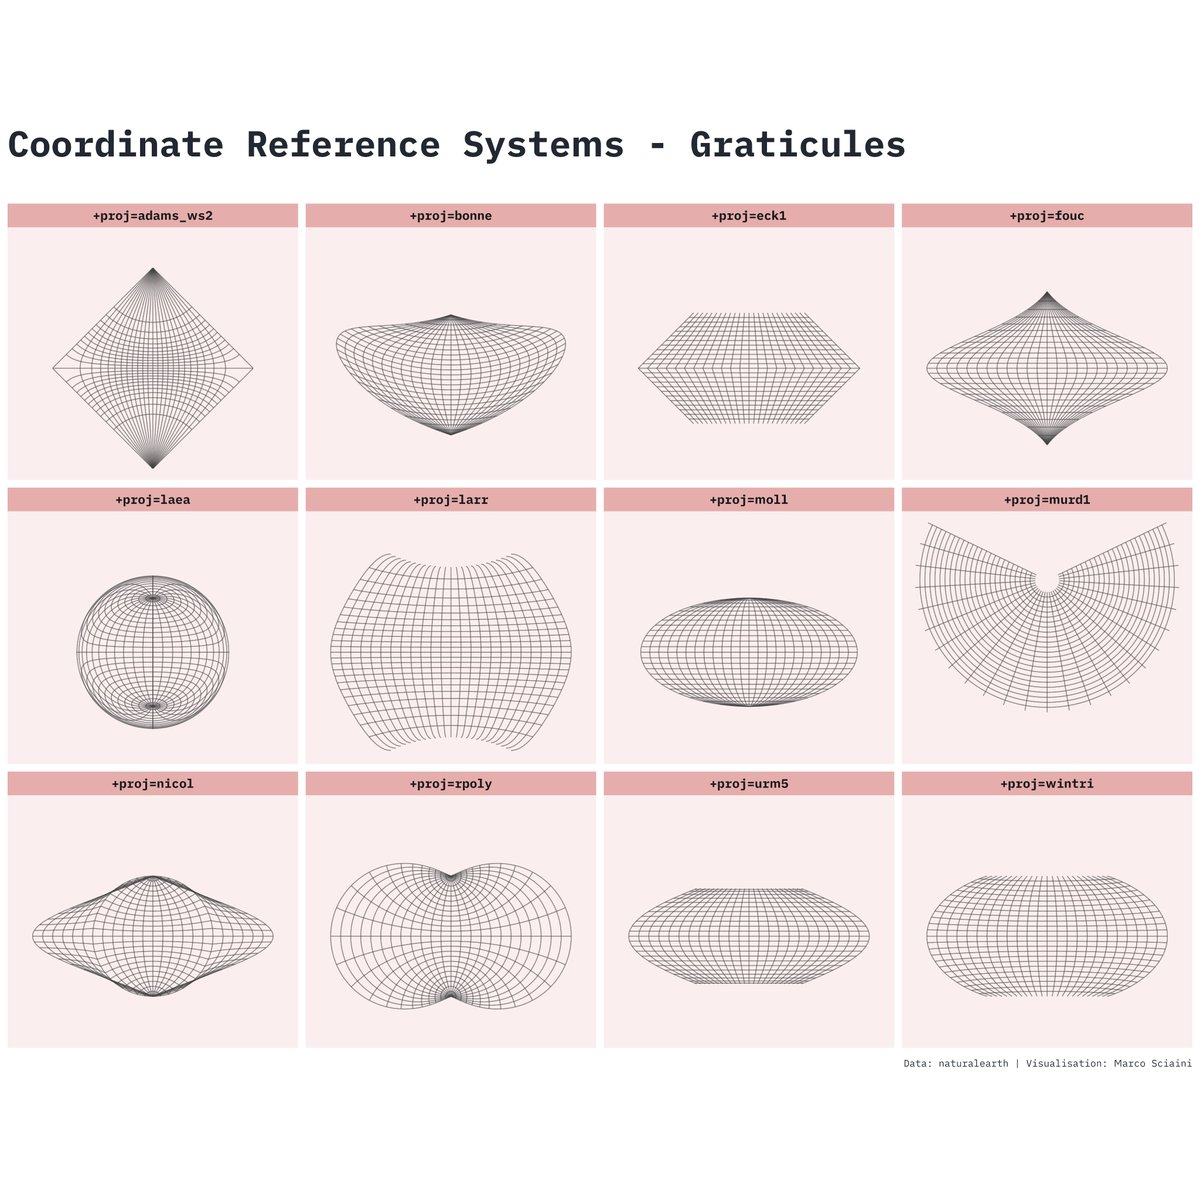
#30DayMapChallenge | Day 2 | #lines Day 2 was an opportunity to finally understand how to implement graticules in #ggplot2 with geom_sf that I can fully control. 💻 Code: gist.github.com/marcosci/ce0d7… #rstats #rspatial #gischat #dataviz

#30DayMapChallenge | Day 2 | #lines

Day 2 was an opportunity to finally understand how to implement graticules in #ggplot2 with geom_sf that I can fully control.

💻 Code: gist.github.com/marcosci/ce0d7…

#rstats #rspatial #gischat #dataviz
Marco Sciaini (@shinysci) 's Twitter Profile Photo

#30DayMapChallenge | Day 3 | #polygons Cleaning up the code and polishing a visualisation I did earlier this year - the impressive work "What if it was your City" by Alberto Lucas López. Works for every address. 💻 Code: gist.github.com/marcosci/bab89… #rstats #rspatial #gischat #dataviz

#30DayMapChallenge | Day 3 | #polygons 

Cleaning up the code and polishing a visualisation I did earlier this year - the impressive work "What if it was your City" by <a href="/aLucasLopez/">Alberto Lucas López</a>. Works for every address. 

💻 Code: gist.github.com/marcosci/bab89…

#rstats #rspatial #gischat #dataviz
terence (@researchremora) 's Twitter Profile Photo

Day 19 of #30DayMapChallenge: Globe. In this case, nine globes—can you spot Pluto?—and a sliver of the largest globe. A map of the solar system, inspired and made possible by Marco Sciaini and Tyler Morgan-Wall. #rayrender adventures, an #rstats tale

Day 19 of #30DayMapChallenge: Globe. In this case, nine globes—can you spot Pluto?—and a sliver of the largest globe. A map of the solar system, inspired and made possible by <a href="/shinysci/">Marco Sciaini</a> and <a href="/tylermorganwall/">Tyler Morgan-Wall</a>.

#rayrender adventures, an #rstats tale
Stefan Reifenberg (@reyfenberg) 's Twitter Profile Photo

🛰️ project done. I was inspired by the article from Julius Tröger, @benjazehr et al. in DIE ZEIT and tried to replicate the central part in #threejs. Build with #svelte using Threlte. It's not gonna work on mobile 😀 Live link: three-satellites.vercel.app Svelte Society 🧡

Cédric Scherer (@cedscherer) 's Twitter Profile Photo

Last workshop of the year ✅ 🥳 Thanks Alenka Gucek for inviting me for these particular #ggplot2 workshops season and everyone else who thought its valuable paying me to talk about #dataviz and #rstats 🙌

Last workshop of the year ✅ 🥳

Thanks <a href="/alenka_gucek/">Alenka Gucek</a> for inviting me for these particular #ggplot2 workshops season and everyone else who thought its valuable paying me to talk about #dataviz and #rstats 🙌
Arthur Welle (@arthurwelle) 's Twitter Profile Photo

20) 𝙉𝙇𝙈𝙍:: is an R package for simulating neutral landscape models (Marco Sciaini, @sebastian_hanss, Cédric Scherer, @alexchubaty, @MHKHesselbarth, @ma_salmon)

20) 𝙉𝙇𝙈𝙍:: is an R package for simulating neutral landscape models (<a href="/shinysci/">Marco Sciaini</a>, @sebastian_hanss, <a href="/CedScherer/">Cédric Scherer</a>, @alexchubaty, @MHKHesselbarth, @ma_salmon)
Samuel Brielmaier (@sbrielmaier) 's Twitter Profile Photo

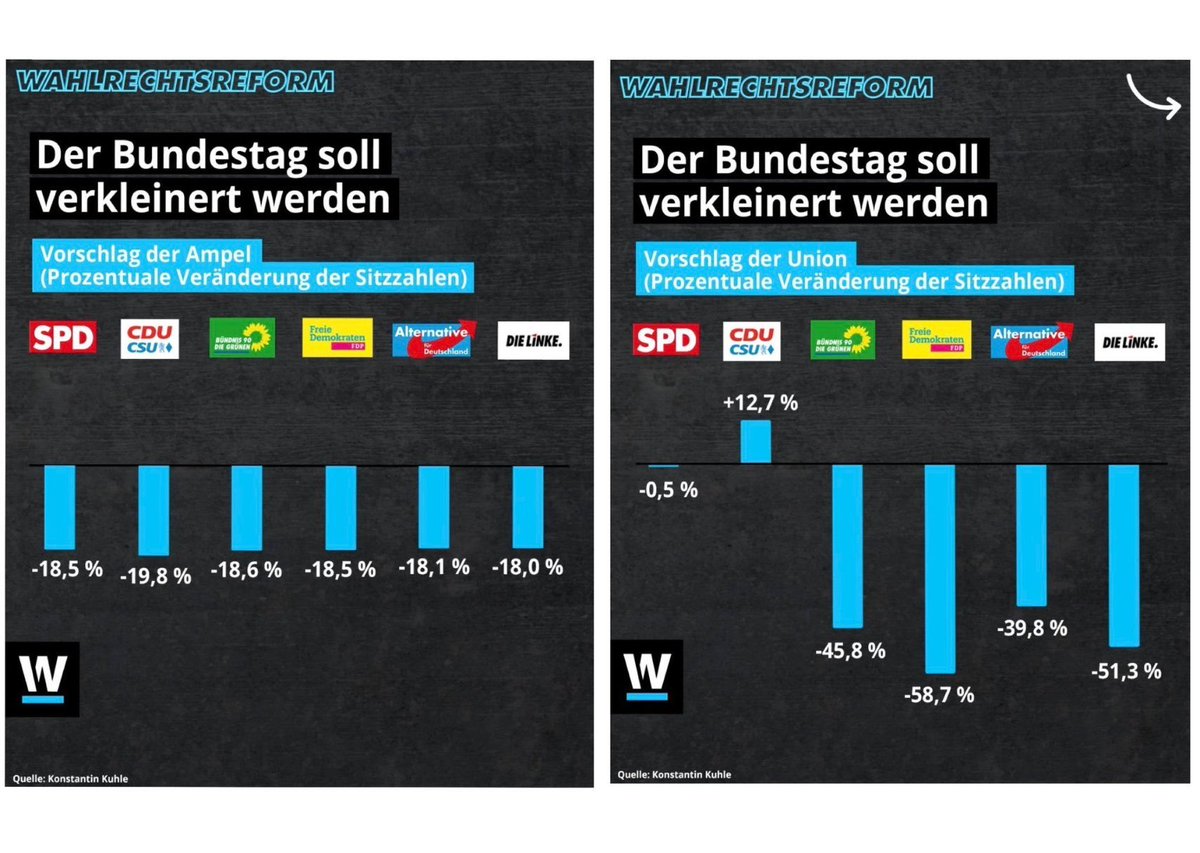
Insbesondere die CDU·CSU kritisiert in der Debatte zur #Wahlrechtsreform, die Ampel würde sich bevorteilen. Kleiner reminder, dass nach dem ursprünglichen Grabenwahlrechts-Vorschlag der Union literally ALLE Fraktionen Nachteile erfahren hätten außer die Union selbst.

Insbesondere die <a href="/cducsubt/">CDU·CSU</a> kritisiert in der Debatte zur #Wahlrechtsreform, die Ampel würde sich bevorteilen. Kleiner reminder, dass nach dem ursprünglichen Grabenwahlrechts-Vorschlag der Union literally ALLE Fraktionen Nachteile erfahren hätten außer die Union selbst.
Prof. Stefan Rahmstorf 🌏 🦣 (@rahmstorf) 's Twitter Profile Photo

It is quite annoying when an autocratic company owner replaces the Twitter bird logo with the doge logo of a dodgy cryptocurrency (top left).

It is quite annoying when an autocratic company owner replaces the Twitter bird logo with the doge logo of a dodgy cryptocurrency (top left).
Marco Sciaini (@shinysci) 's Twitter Profile Photo

🔍 Explore the hidden secrets of urban layouts with #rstats! Analysing street orientation the #rspatial way includes just a few lines of code to come up with this plot for every city on earth. 💾 gist: gist.github.com/marcosci/2a26e…… #gischat

🔍 Explore the hidden secrets of urban layouts with #rstats! Analysing street orientation the #rspatial way includes just a few lines of code to come up with this plot for every city on earth.  

💾 gist: gist.github.com/marcosci/2a26e…… 

#gischat
Marco Sciaini (@shinysci) 's Twitter Profile Photo

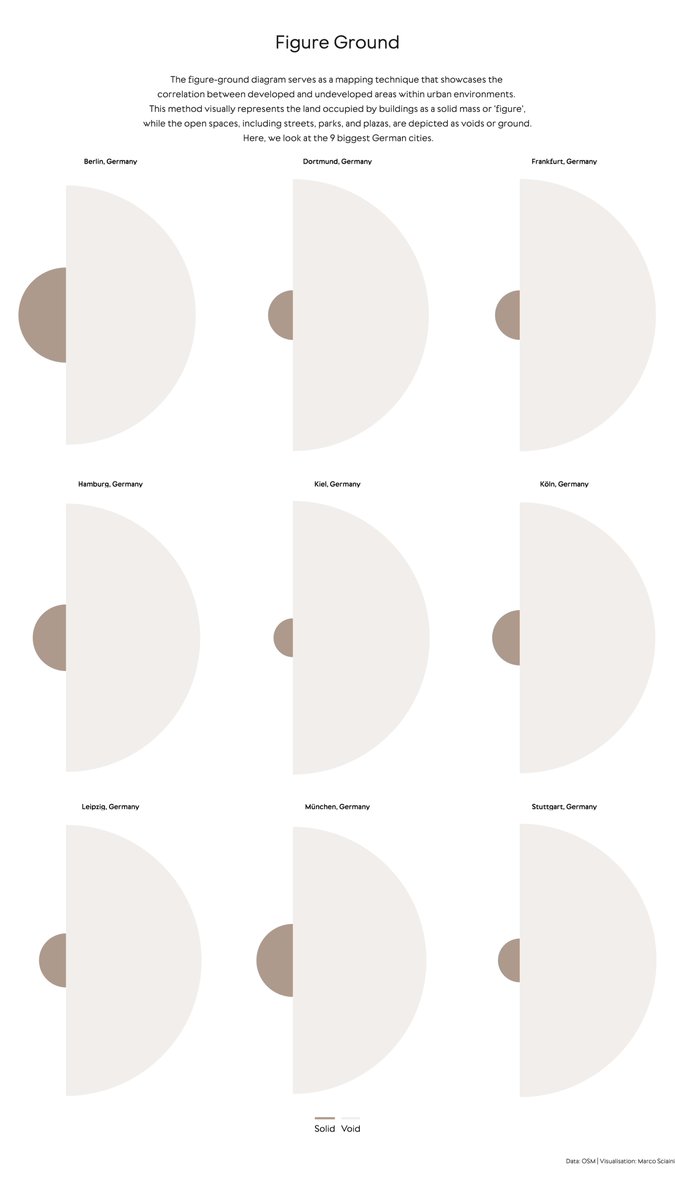
🏘️ Lets look at the figure-ground diagram for the nine biggest German cities. It let's us interpret the continuity of open space in an urban environment by showing the ratio of built-up and open space. 💾 code: gist.github.com/marcosci/57430… #rstats #rspatial #gischat #urbananalytics

🏘️ Lets look at the figure-ground diagram for the nine biggest German cities. It let's us interpret the continuity of open space in an urban environment by showing the ratio of built-up and open space.

💾 code: gist.github.com/marcosci/57430…

#rstats #rspatial #gischat #urbananalytics