St. Louis Fed (@stlouisfed) 's Twitter Profile
St. Louis Fed

@stlouisfed

Official Federal Reserve Bank of St. Louis account. We share economic data and insights. Home to FRED®, @FedFRASER & @FedHistory

ID: 71567590

linkhttp://www.stlouisfed.org/ calendar_today04-09-2009 15:57:18

52,52K Tweet

234,234K Followers

37 Following

St. Louis Fed (@stlouisfed) 's Twitter Profile Photo

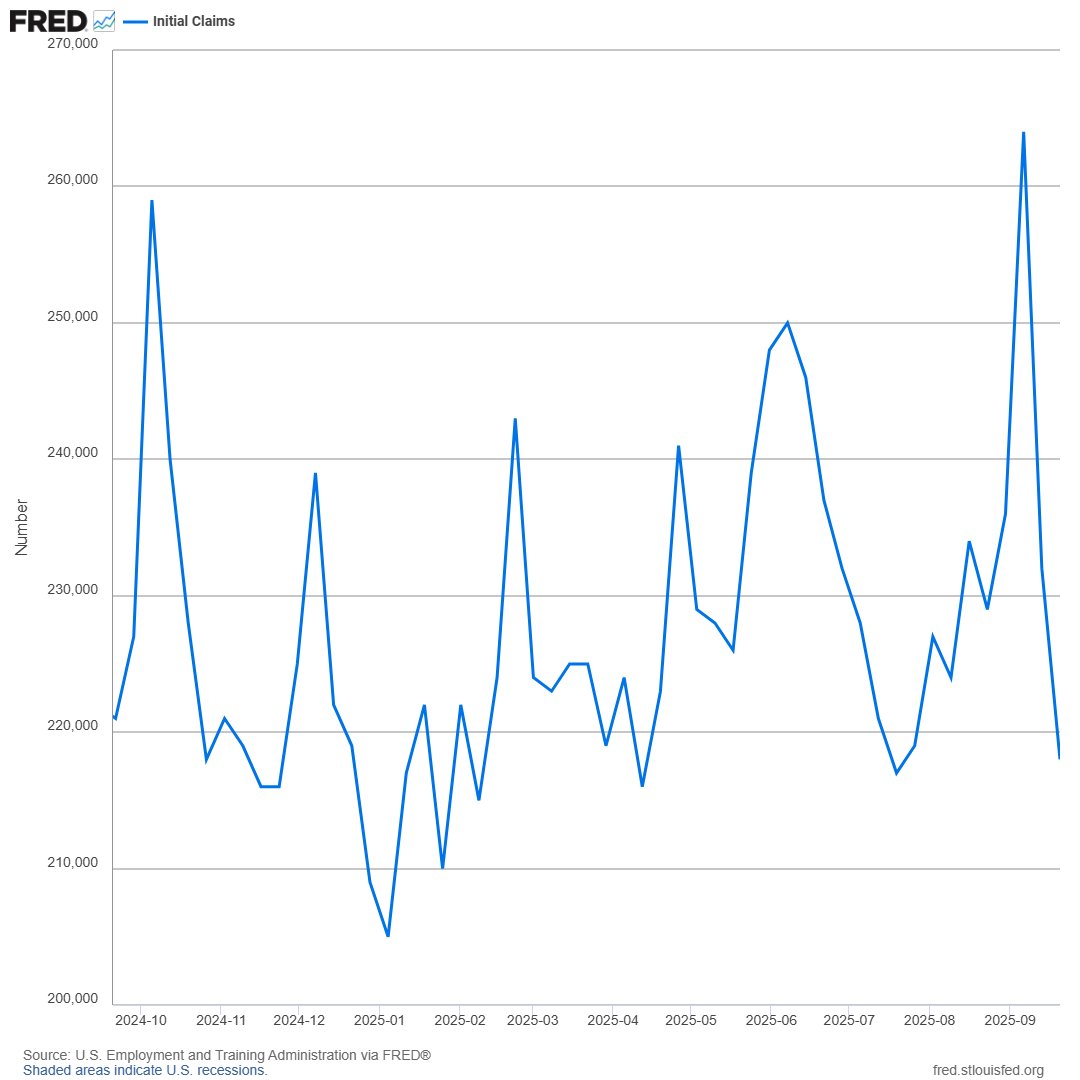
In the week ending Sept. 20, the number of Americans filing new applications for unemployment insurance benefits fell by 14,000 to 218,000—the lowest level in nine weeks bit.ly/46okxa6

In the week ending Sept. 20, the number of Americans filing new applications for unemployment insurance benefits fell by 14,000 to 218,000—the lowest level in nine weeks bit.ly/46okxa6
St. Louis Fed (@stlouisfed) 's Twitter Profile Photo

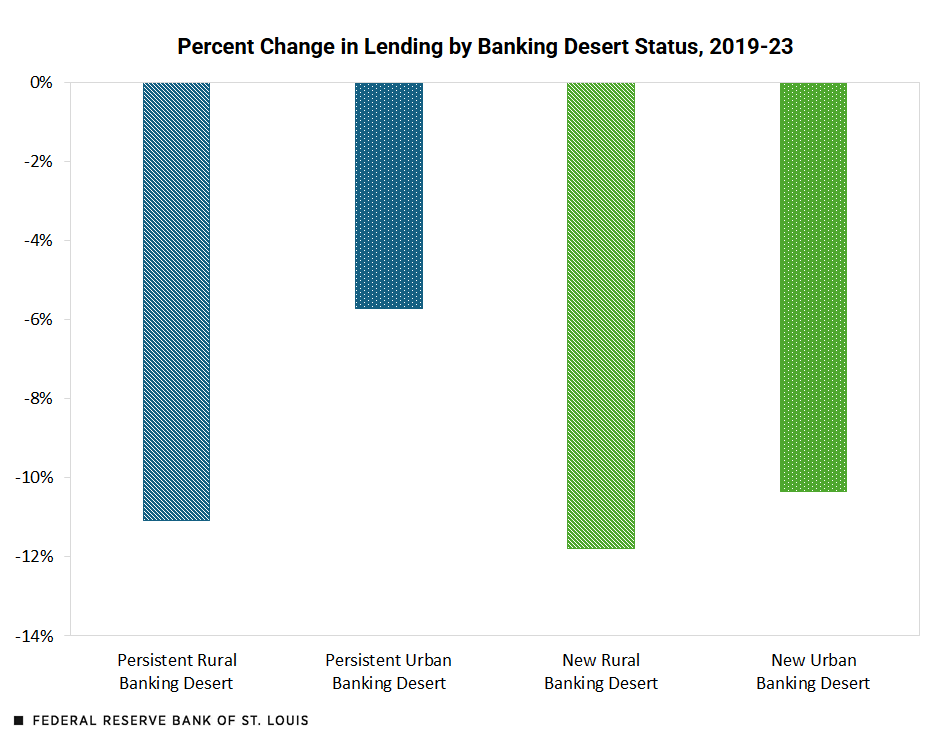
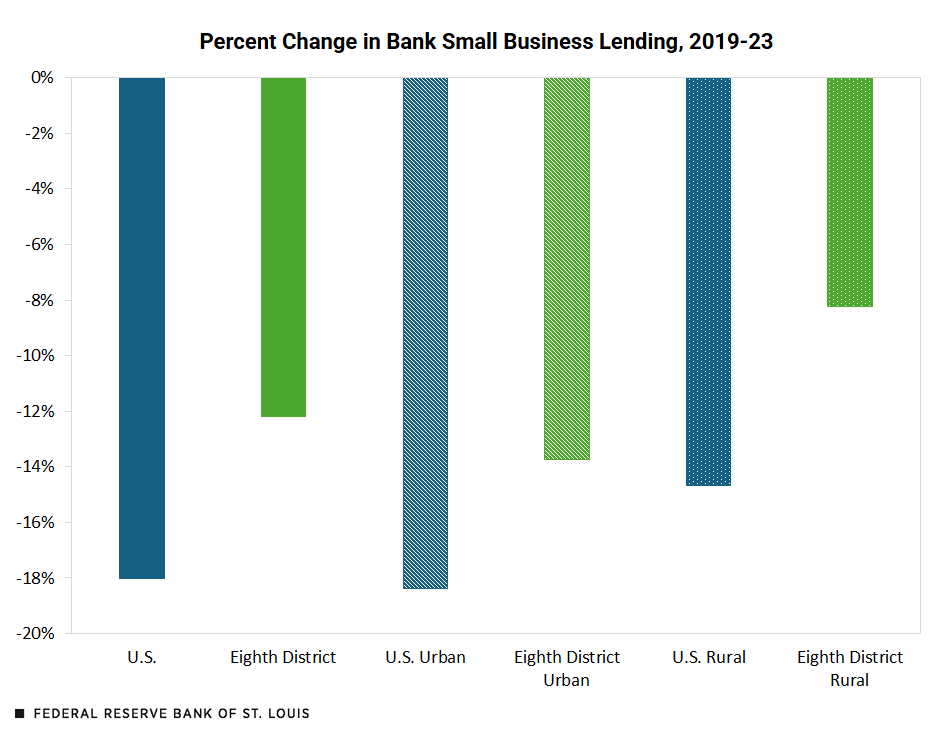
💼 Small businesses help drive the economy, but access to capital is crucial for their growth. Dive into our blog post on bank lending trends in rural areas, including banking deserts. Read now: bit.ly/3VB7JqE

💼 Small businesses help drive the economy, but access to capital is crucial for their growth. Dive into our blog post on bank lending trends in rural areas, including banking deserts. Read now:
bit.ly/3VB7JqE
St. Louis Fed (@stlouisfed) 's Twitter Profile Photo

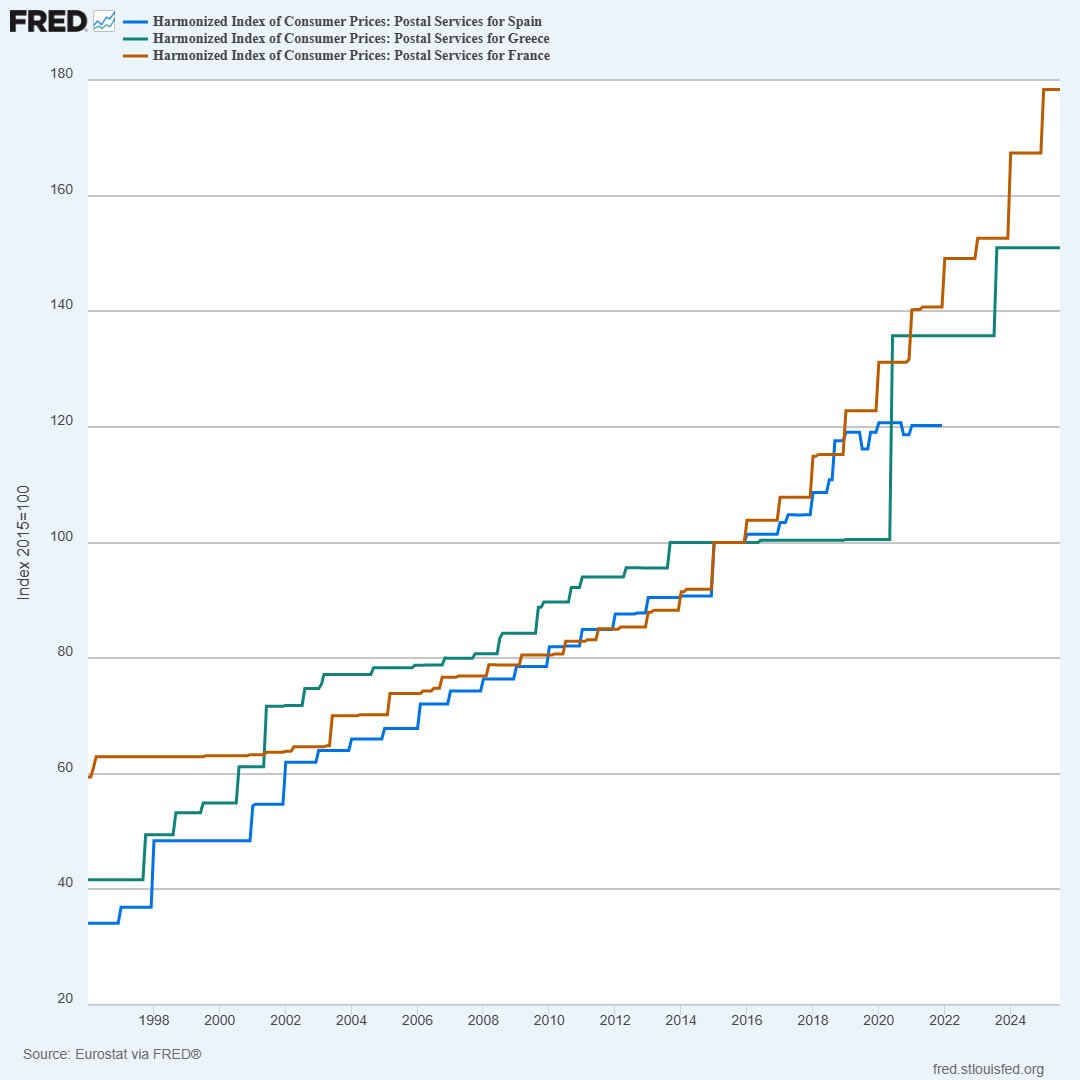
FRED has price index data for many countries and many products, including postage stamps. Check the FRED Blog for an analysis of Europe’s post office posture bit.ly/4niHilB

FRED has price index data for many countries and many products, including postage stamps. Check the FRED Blog for an analysis of Europe’s post office posture bit.ly/4niHilB
St. Louis Fed (@stlouisfed) 's Twitter Profile Photo

The nation’s personal saving rate as a share of disposable personal income edged lower for a fourth straight month in August, dipping to 4.6%. See this result and newly released BEA News revisions starting in January 2020 in archival database ALFRED: bit.ly/46BzRPm

The nation’s personal saving rate as a share of disposable personal income edged lower for a fourth straight month in August, dipping to 4.6%. See this result and newly released <a href="/BEA_News/">BEA News</a> revisions starting in January 2020 in archival database ALFRED: bit.ly/46BzRPm
St. Louis Fed (@stlouisfed) 's Twitter Profile Photo

The personal consumption expenditures (PCE) price index increased at an annual rate of 2.7% in August, up from a 2.6% rise in July. Excluding food and energy costs, the “core PCE” price level held at 2.9% on an annual basis bit.ly/4nwuoRm

The personal consumption expenditures (PCE) price index increased at an annual rate of 2.7% in August, up from a 2.6% rise in July. Excluding food and energy costs, the “core PCE” price level held at 2.9% on an annual basis bit.ly/4nwuoRm
St. Louis Fed (@stlouisfed) 's Twitter Profile Photo

Trimmed mean PCE inflation rate, an alternate measure of core inflation from Dallas Fed, was 2.75% for the 12 months ending in August, little changed from July bit.ly/42fngA6
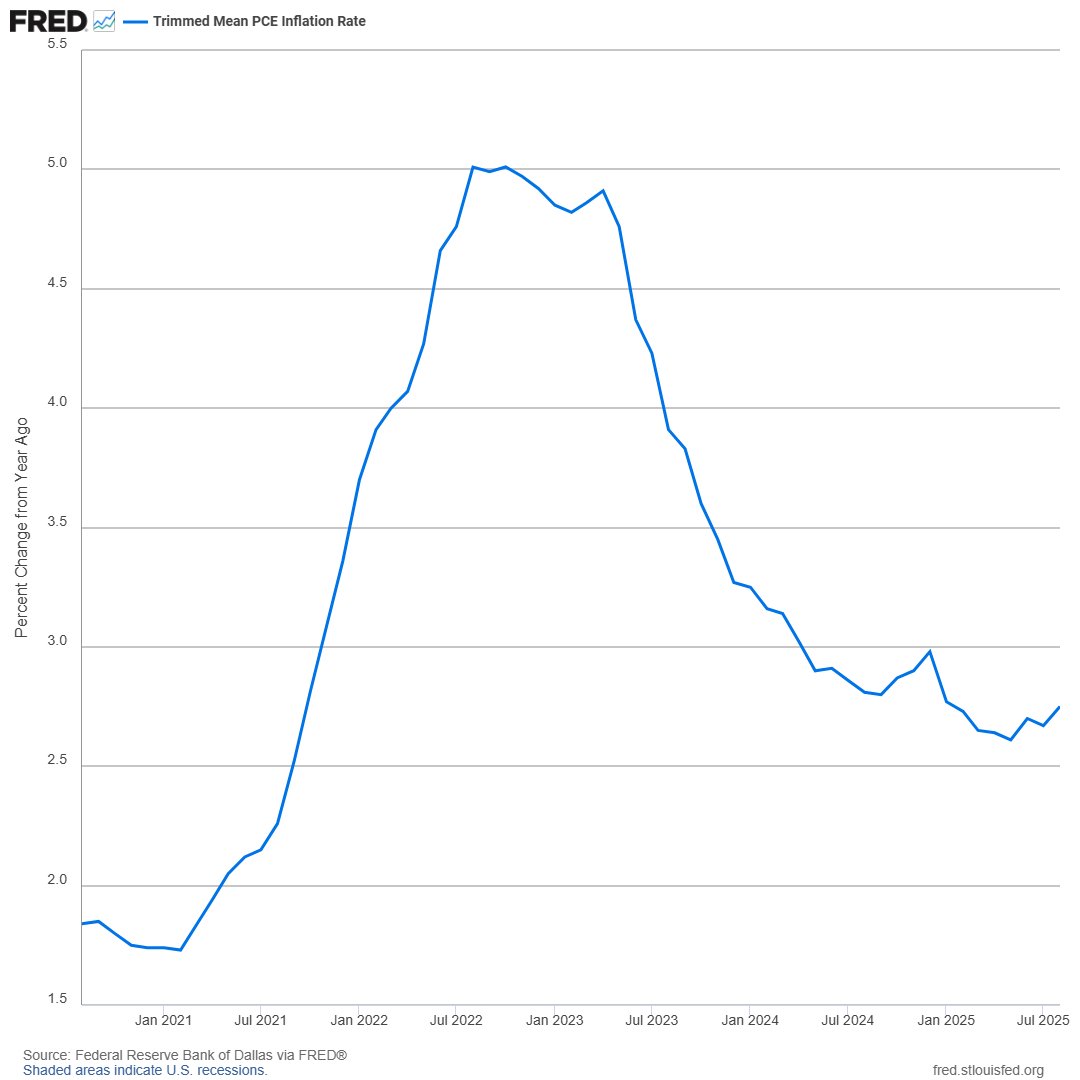
Trimmed mean PCE inflation rate, an alternate measure of core inflation from <a href="/DallasFed/">Dallas Fed</a>, was 2.75% for the 12 months ending in August, little changed from July bit.ly/42fngA6
St. Louis Fed (@stlouisfed) 's Twitter Profile Photo

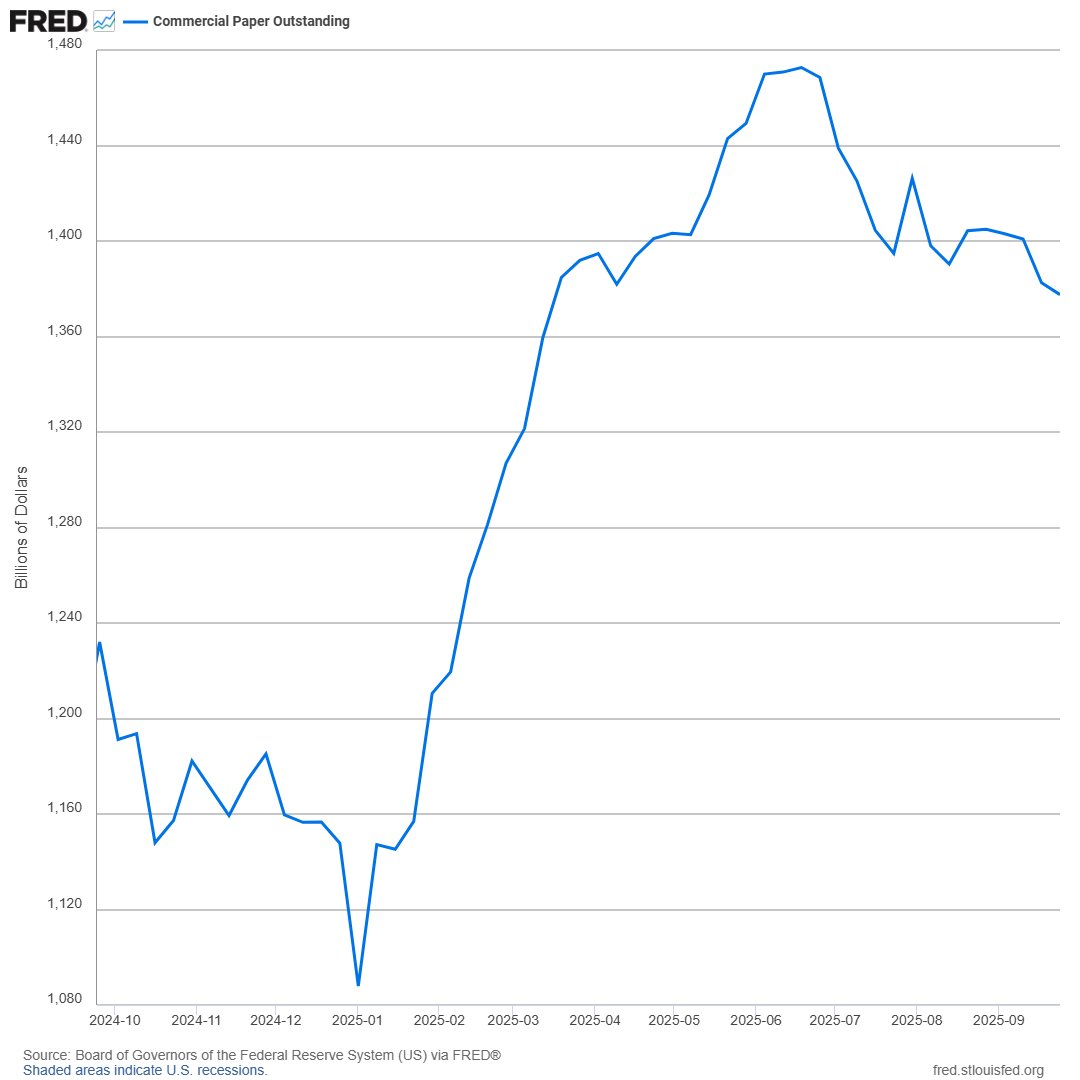
U.S. commercial paper outstanding dipped to the lowest level since mid-March in the week ending Sept. 24, declining by $5 billion from a week earlier to $1.38 trillion bit.ly/42g9hKp

U.S. commercial paper outstanding dipped to the lowest level since mid-March in the week ending Sept. 24, declining by $5 billion from a week earlier to $1.38 trillion bit.ly/42g9hKp
St. Louis Fed (@stlouisfed) 's Twitter Profile Photo

🏦📊 Regional Insight: In the St. Louis Fed’s Eighth District, small business lending by banks declined 12% from 2019 to 2023. Nationally, the drop was 18%. What was the breakdown for urban and rural areas? For firms in new or persistent banking deserts? bit.ly/4gKhPzh

🏦📊 Regional Insight: In the St. Louis Fed’s Eighth District, small business lending by banks declined 12% from 2019 to 2023. Nationally, the drop was 18%. What was the breakdown for urban and rural areas? For firms in new or persistent banking deserts?
bit.ly/4gKhPzh
St. Louis Fed (@stlouisfed) 's Twitter Profile Photo

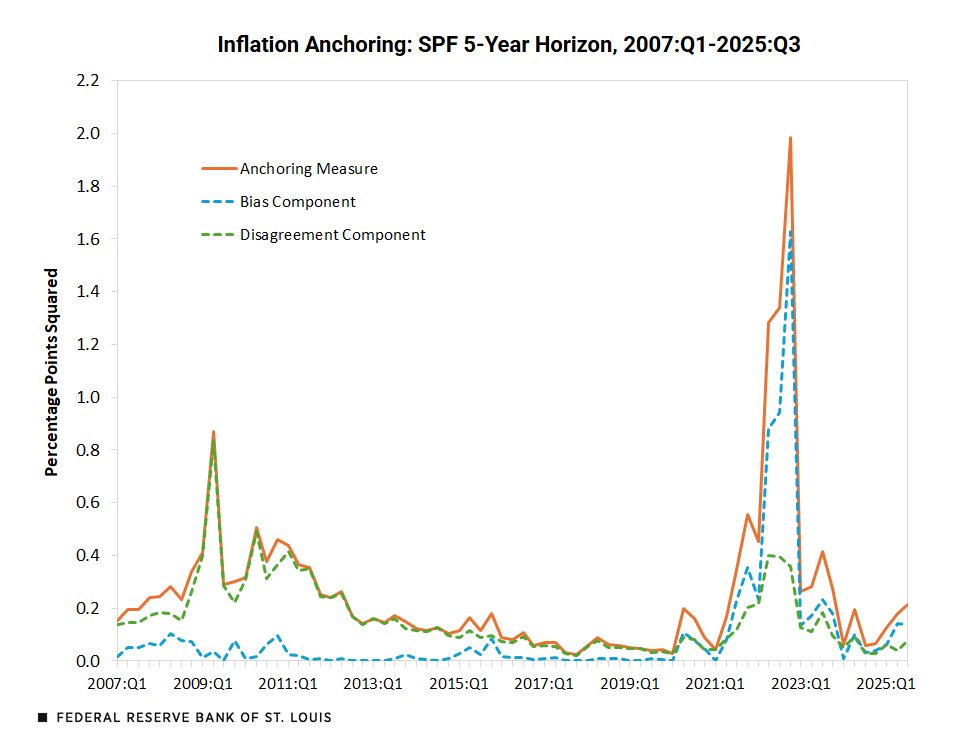
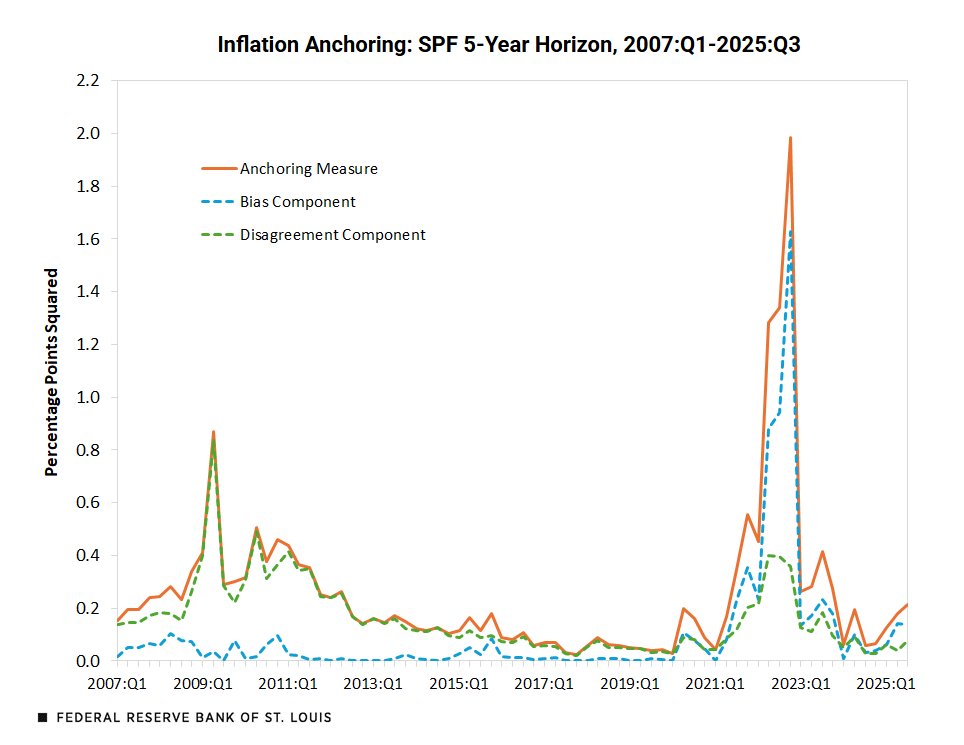
What anchors inflation expectations? A new analysis breaks down how anticipated drift from the Fed’s 2% target and divergence among forecasts each contribute to the overall degree of anchoring at various horizons bit.ly/4gSSTFS

What anchors inflation expectations? A new analysis breaks down how anticipated drift from the Fed’s 2% target and divergence among forecasts each contribute to the overall degree of anchoring at various horizons bit.ly/4gSSTFS
St. Louis Fed (@stlouisfed) 's Twitter Profile Photo

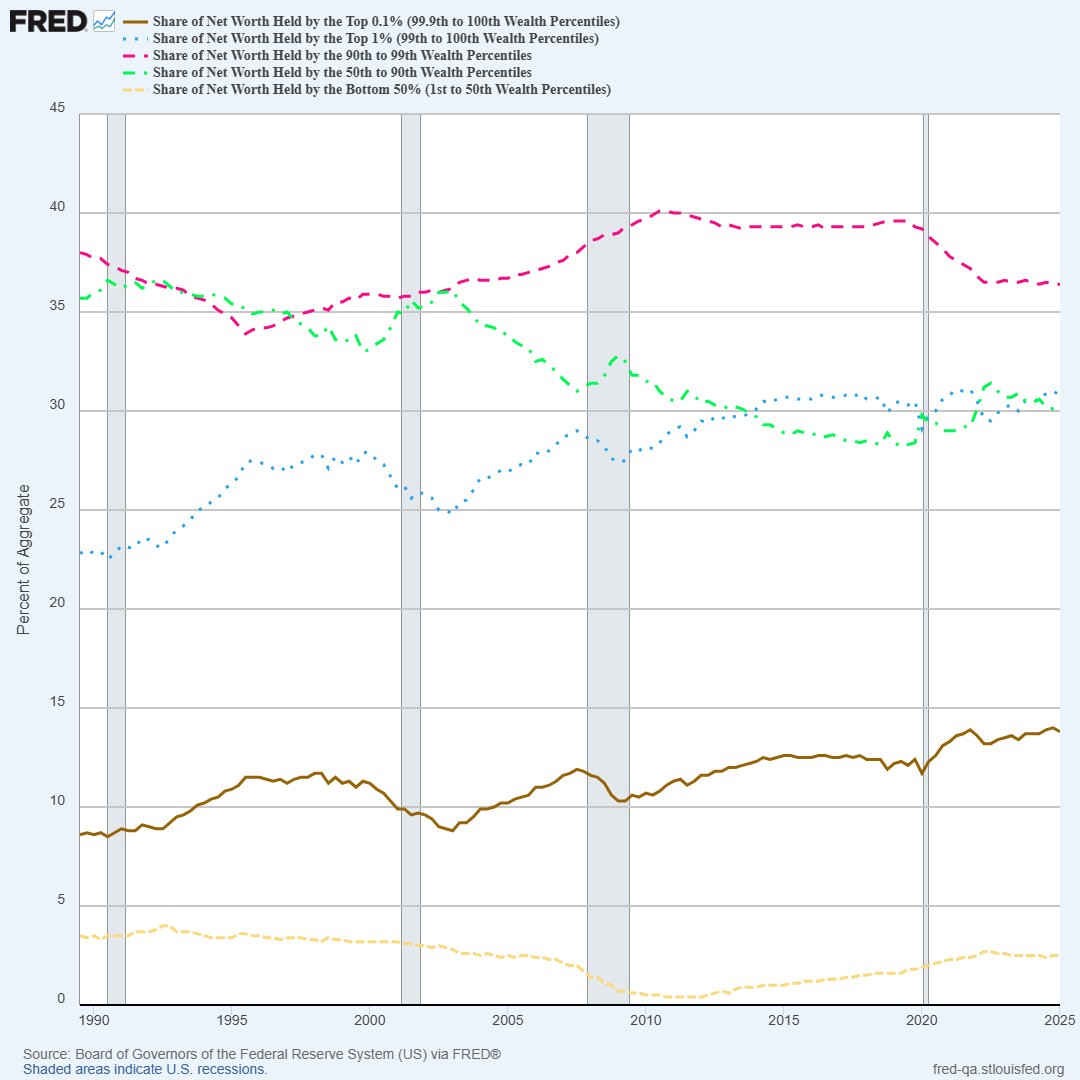
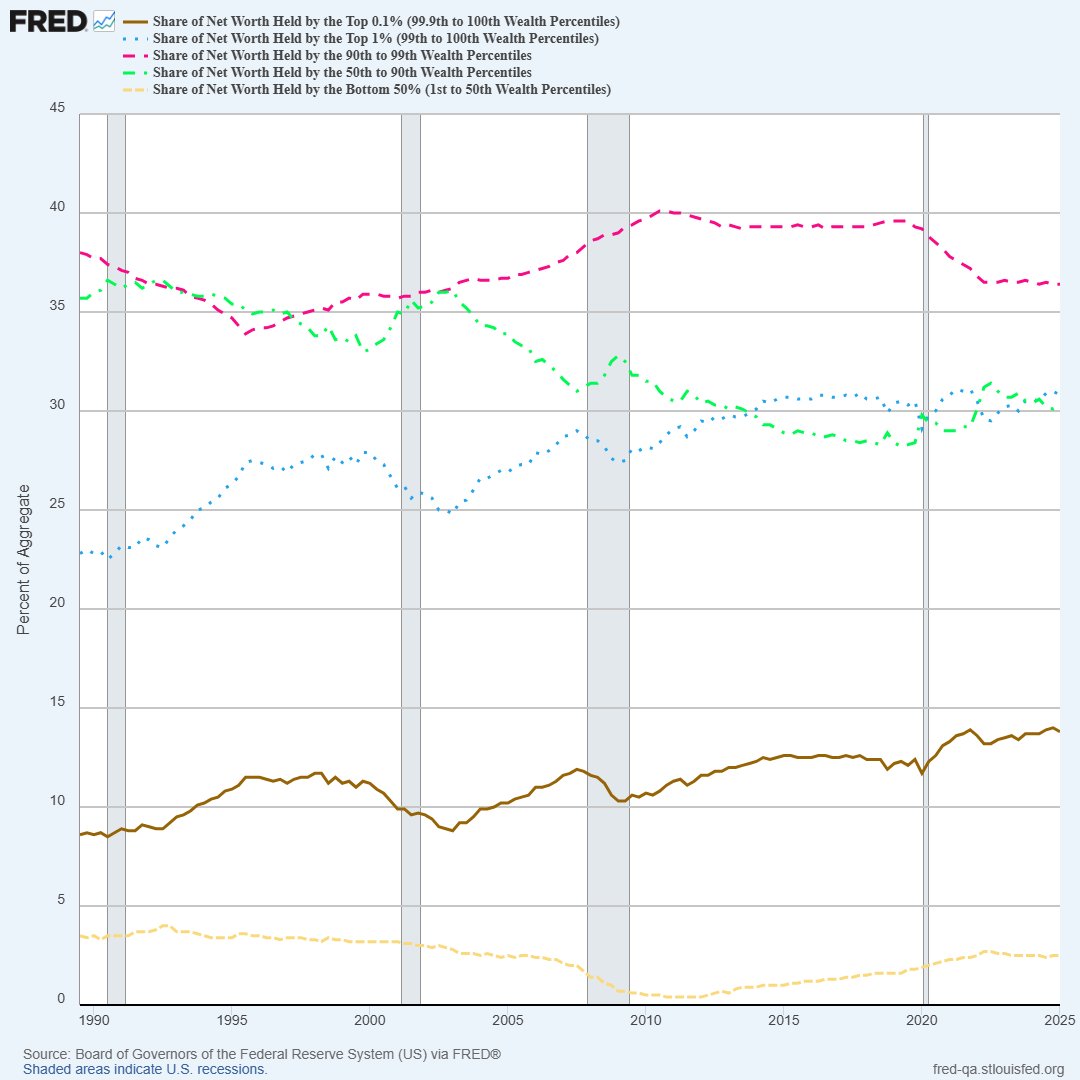
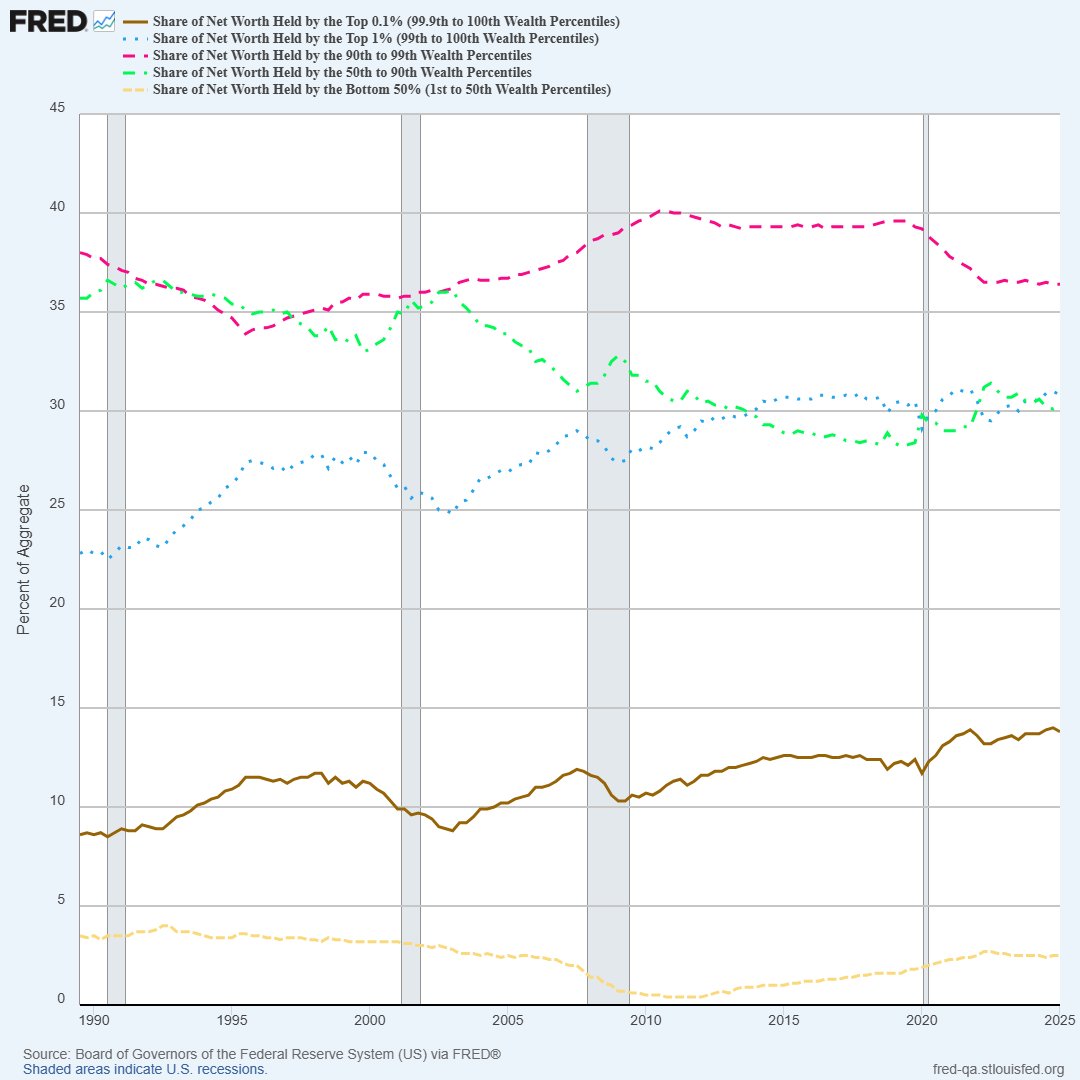
What did the pandemic do to trends in net worth? The FRED Blog tracks big changes in wealth for two groups of U.S. households bit.ly/4pOklsi

What did the pandemic do to trends in net worth? The FRED Blog tracks big changes in wealth for two groups of U.S. households bit.ly/4pOklsi
St. Louis Fed (@stlouisfed) 's Twitter Profile Photo

The daily trade-weighted U.S. dollar index was measuring 111.8 as of Sept. 26 (January 2006=100). Want to track this index or other foreign exchange rates from Federal Reserve? See FRED: bit.ly/3IGBmE3
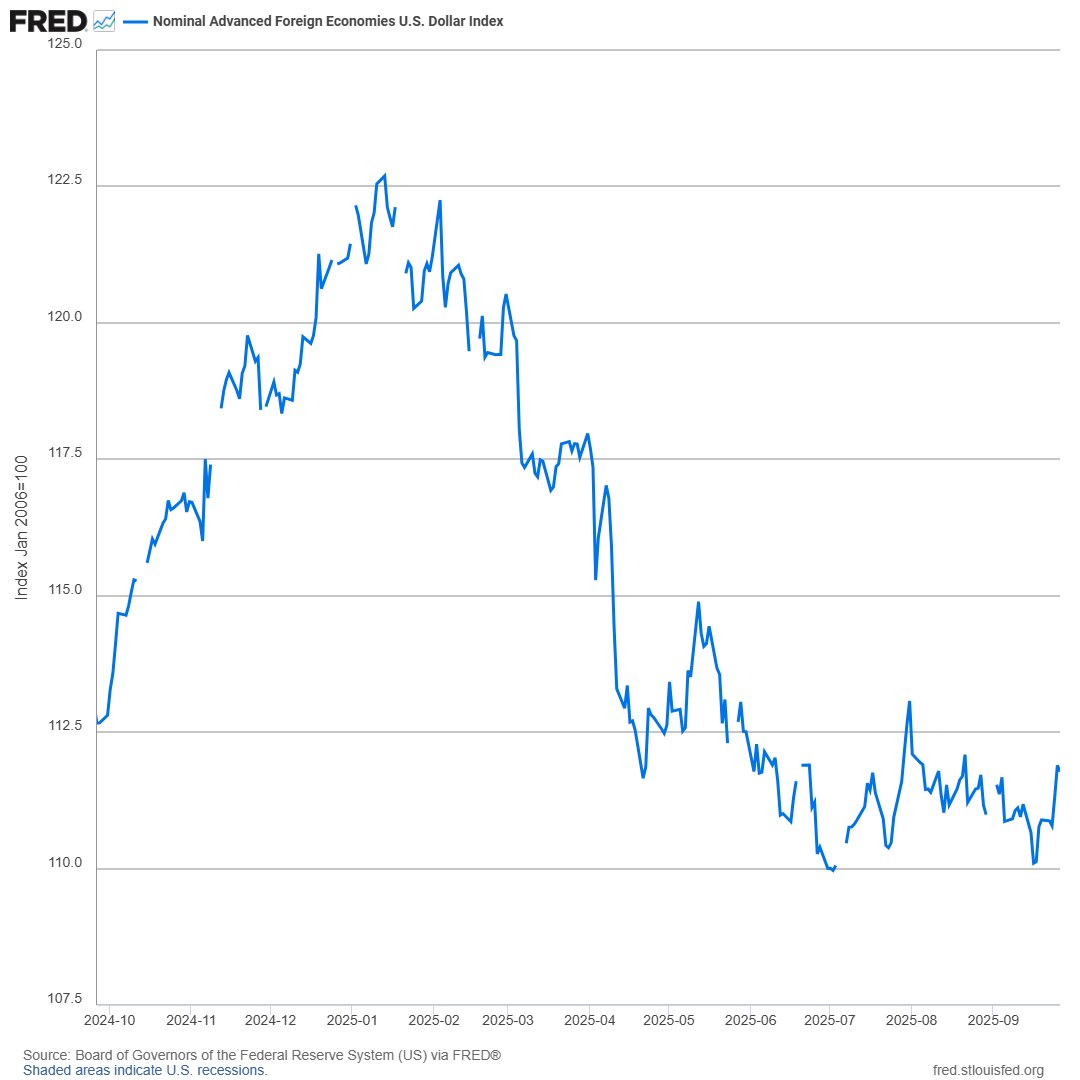
The daily trade-weighted U.S. dollar index was measuring 111.8 as of Sept. 26 (January 2006=100). Want to track this index or other foreign exchange rates from <a href="/federalreserve/">Federal Reserve</a>? See FRED: bit.ly/3IGBmE3
St. Louis Fed (@stlouisfed) 's Twitter Profile Photo

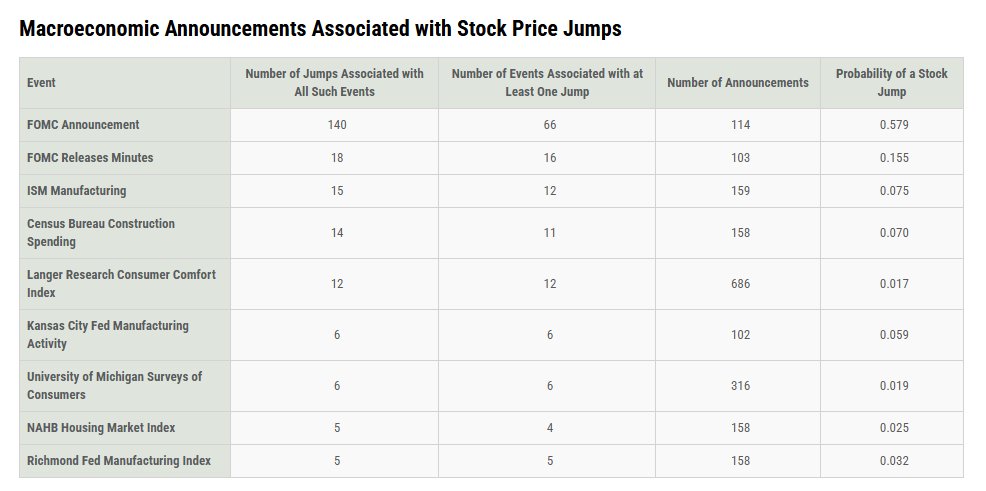
Which macroeconomic announcements tend to be most often associated with jumps in U.S. stock prices? A new post on our blog explores this question using more than 10 years of the DJIA bit.ly/4nDAyPi

Which macroeconomic announcements tend to be most often associated with jumps in U.S. stock prices? A new post on our blog explores this question using more than 10 years of the DJIA bit.ly/4nDAyPi
St. Louis Fed (@stlouisfed) 's Twitter Profile Photo

New from our blog: An analysis looks at two datasets to understand what’s driving the degree to which U.S. inflation expectations are anchored to the Fed’s 2% target. Read more: bit.ly/3KpJ99P

New from our blog: An analysis looks at two datasets to understand what’s driving the degree to which U.S. inflation expectations are anchored to the Fed’s 2% target. Read more: bit.ly/3KpJ99P
St. Louis Fed (@stlouisfed) 's Twitter Profile Photo

Net worth is the difference between total assets and total liabilities. Check the FRED Blog to learn about the changes in net worth since the pandemic bit.ly/4nuEYrX

Net worth is the difference between total assets and total liabilities. Check the FRED Blog to learn about the changes in net worth since the pandemic bit.ly/4nuEYrX
St. Louis Fed (@stlouisfed) 's Twitter Profile Photo

Total nonfarm job openings were little changed in August, at 7.2 million. Hires fell by 114,000, to 5.1 million bit.ly/3IJtdi0

Total nonfarm job openings were little changed in August, at 7.2 million. Hires fell by 114,000, to 5.1 million bit.ly/3IJtdi0
St. Louis Fed (@stlouisfed) 's Twitter Profile Photo

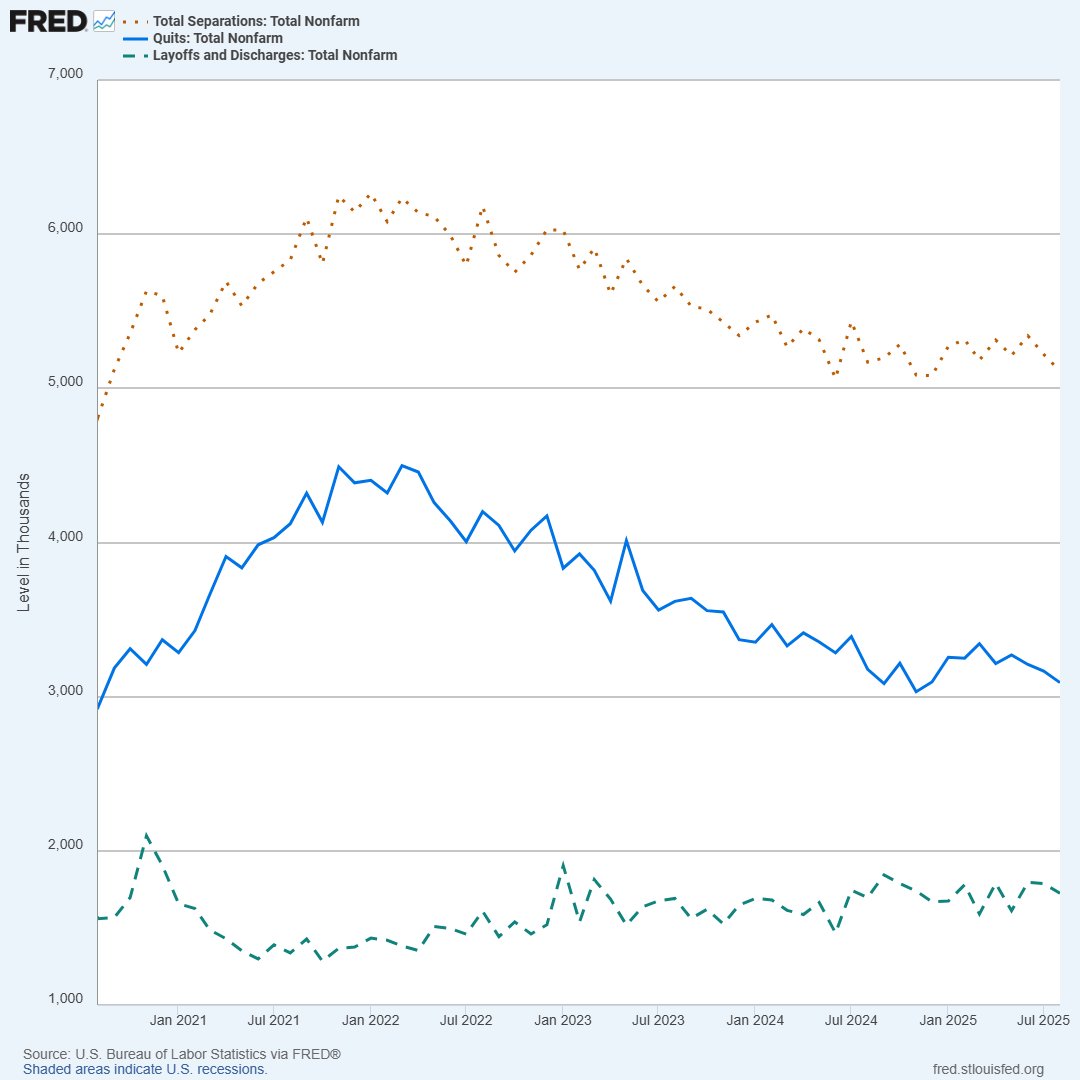
In August, U.S. job separations decreased by 110,000 to 5.11 million. Within separations, quits ticked down to 3.09 million and layoffs and discharges fell to 1.73 million #JOLTS bit.ly/4mNpjmr

In August, U.S. job separations decreased by 110,000 to 5.11 million. Within separations, quits ticked down to 3.09 million and layoffs and discharges fell to 1.73 million #JOLTS bit.ly/4mNpjmr
St. Louis Fed (@stlouisfed) 's Twitter Profile Photo

In July, U.S. home prices as measured by the S&P/Case-Shiller National Home Price Index rose a seasonally adjusted 1.7% year over year, down from 1.9% in June. The 20- and 10-city composite indexes posted 1.8% and 2.3% annual gains, respectively bit.ly/3VLDw8i

In July, U.S. home prices as measured by the S&amp;P/Case-Shiller National Home Price Index rose a seasonally adjusted 1.7% year over year, down from 1.9% in June. The 20- and 10-city composite indexes posted 1.8% and 2.3% annual gains, respectively bit.ly/3VLDw8i